Holstein model
The following figures and data are our benchmarking results (for detailed discussion please see ref1).
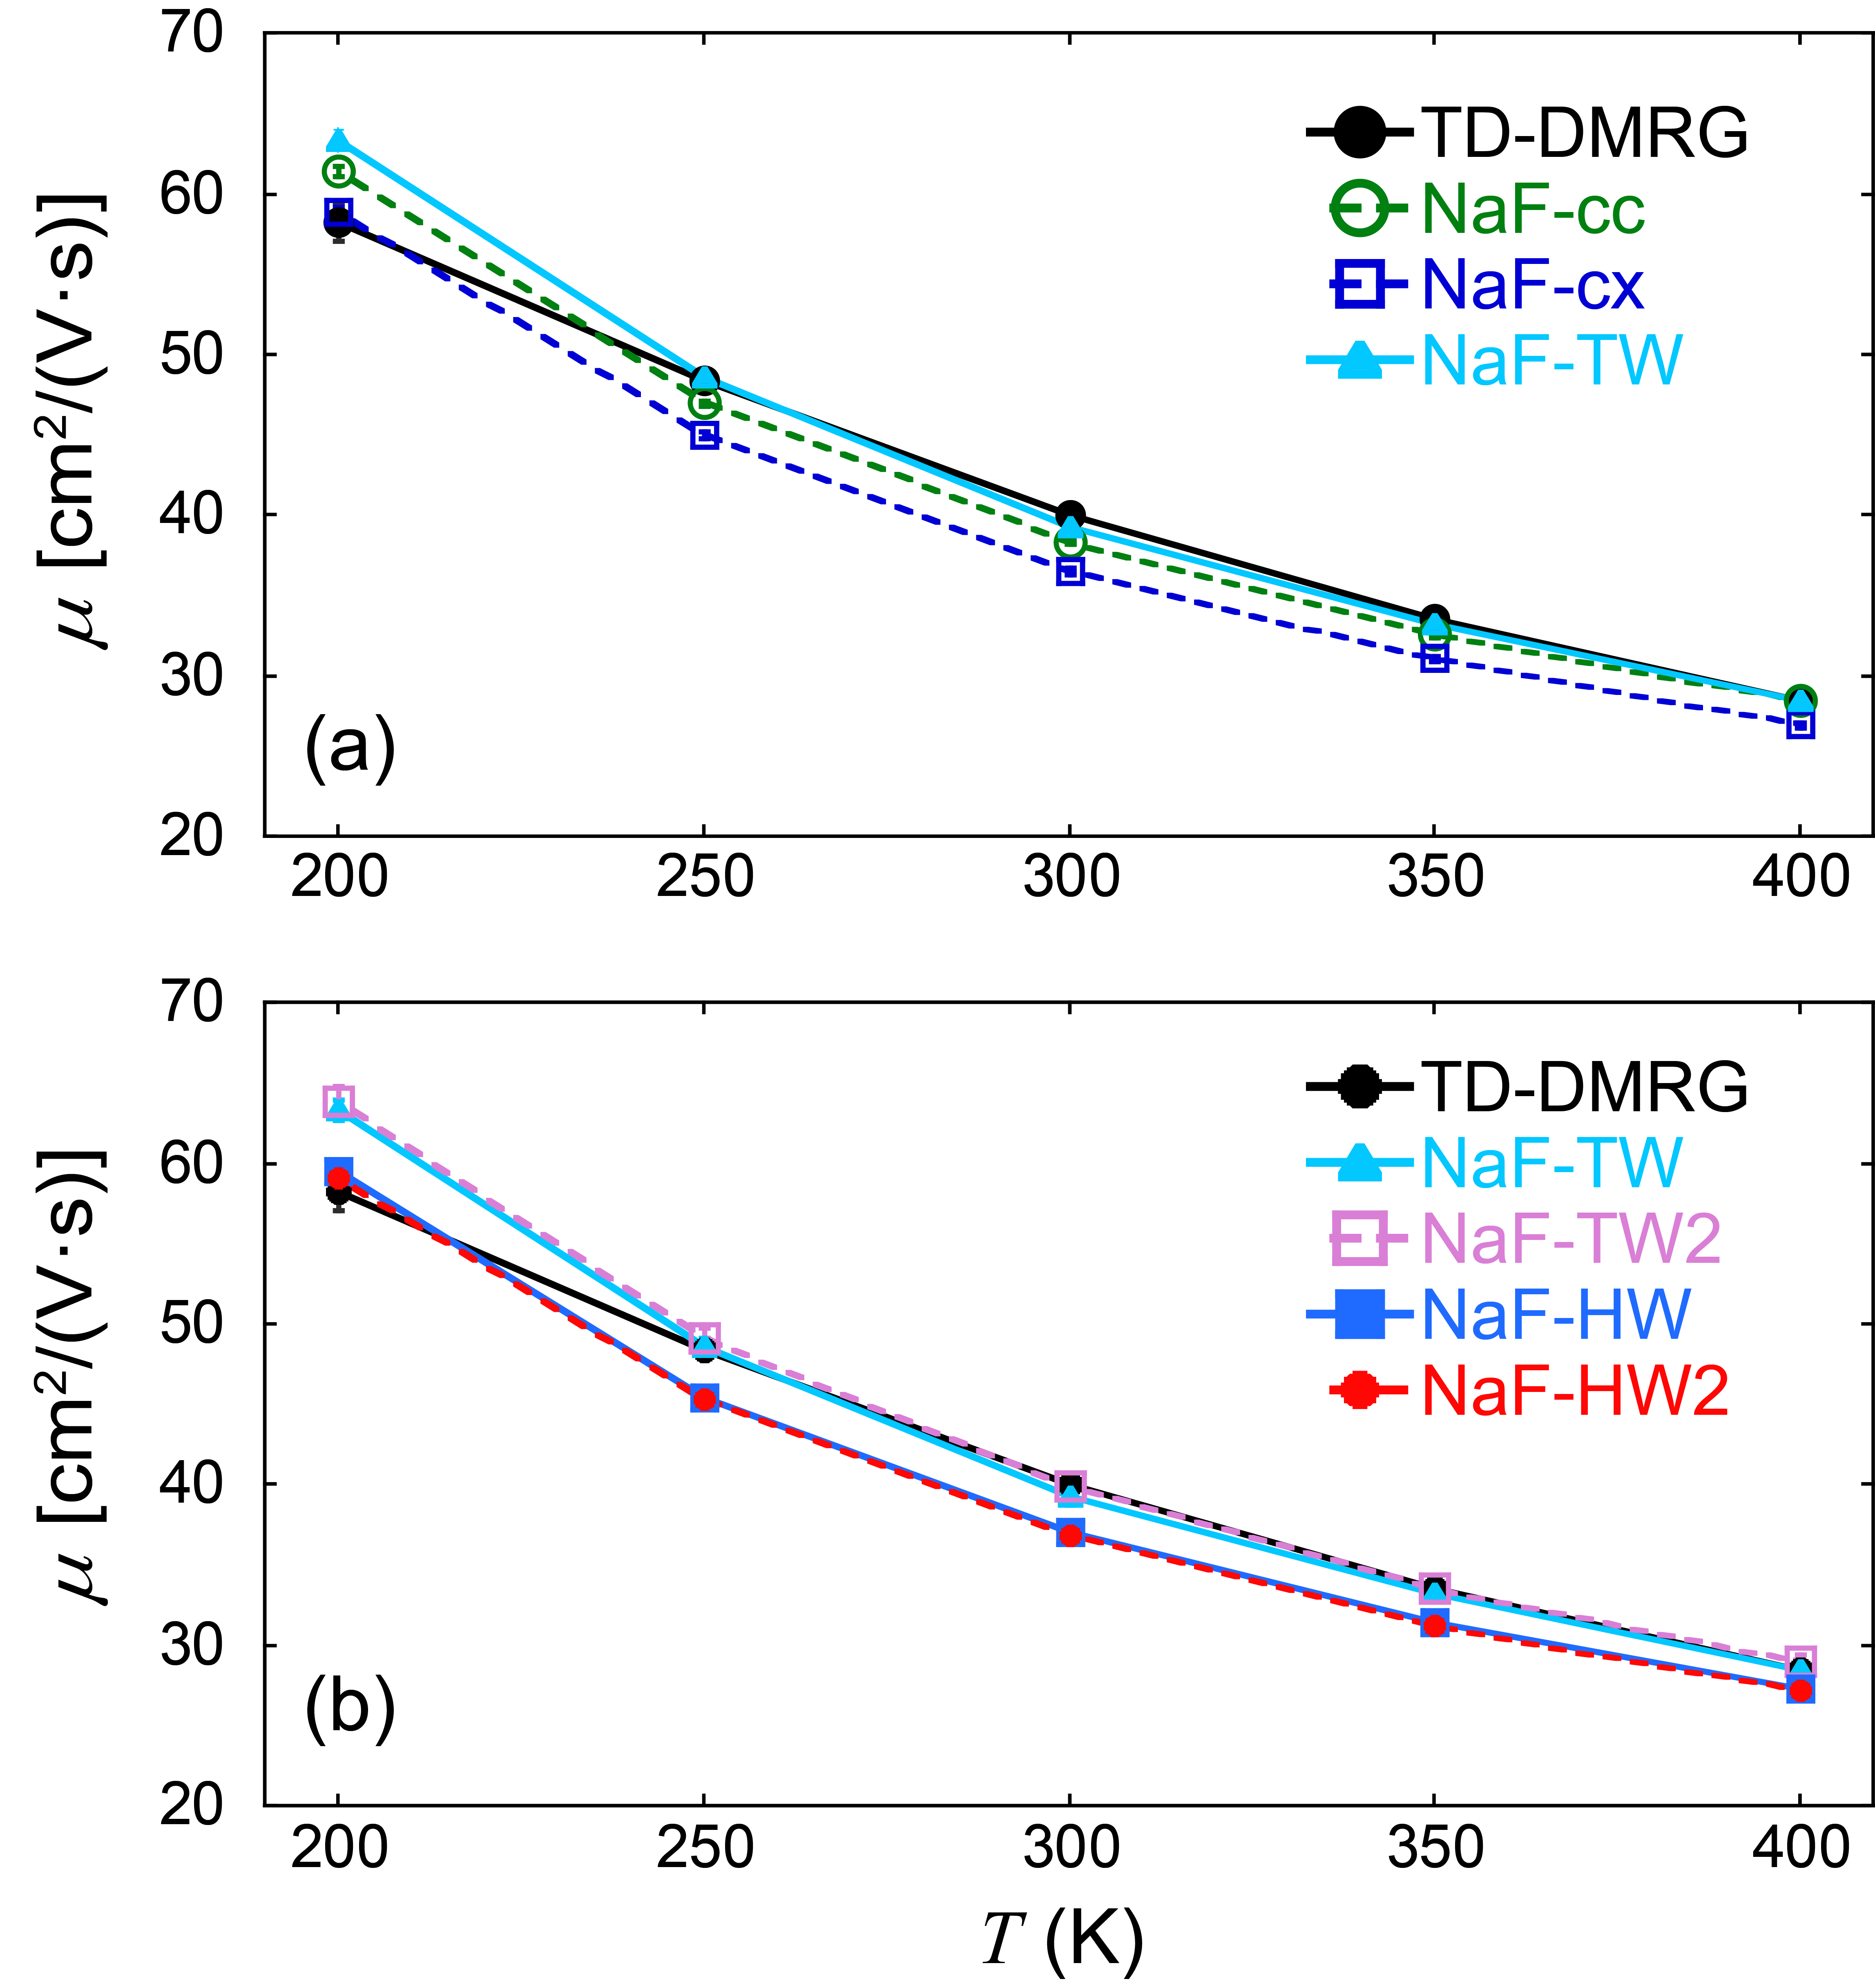
Figure 16. Benchmark results of μ of the one-dimensional Holstein model in ref 2 as functions of temperature. In panel (a), the green hollow circles with green dashed lines, blue hollow squares with blue dashed lines and cyan triangles with cyan solid lines represent the results of NaF-cc; NaF-cx and NaF-TW, respectively. In panel (b), the cyan triangles with cyan solid lines, pink hollow squares with pink dashed lines, blue squares with blue solid lines, red points with red dashed lines represent the results of NaF-TW, NaF-TW2, NaF-HW and NaF-HW2, respectively. In each panel, black points with black solid lines denote the results of TD-DMRG. (Please see more details in Section S5 of the Supporting Information.) Figure S2(c) of the Supporting Information shows that, when the initial nuclear condition is sampled by classical mechanics, the results significantly deviate from the TD-DMRG results. It suggests that nuclear quantum effects are important for this system. Consistent definitions of the electronic coherence-coherence TCF for multistate systems, which satisfy the frozen nuclei limit, are not available for these SH methods in the literature.345 So it will be fair to compare SH methods to TDDMRG and NaF methods in the future. data
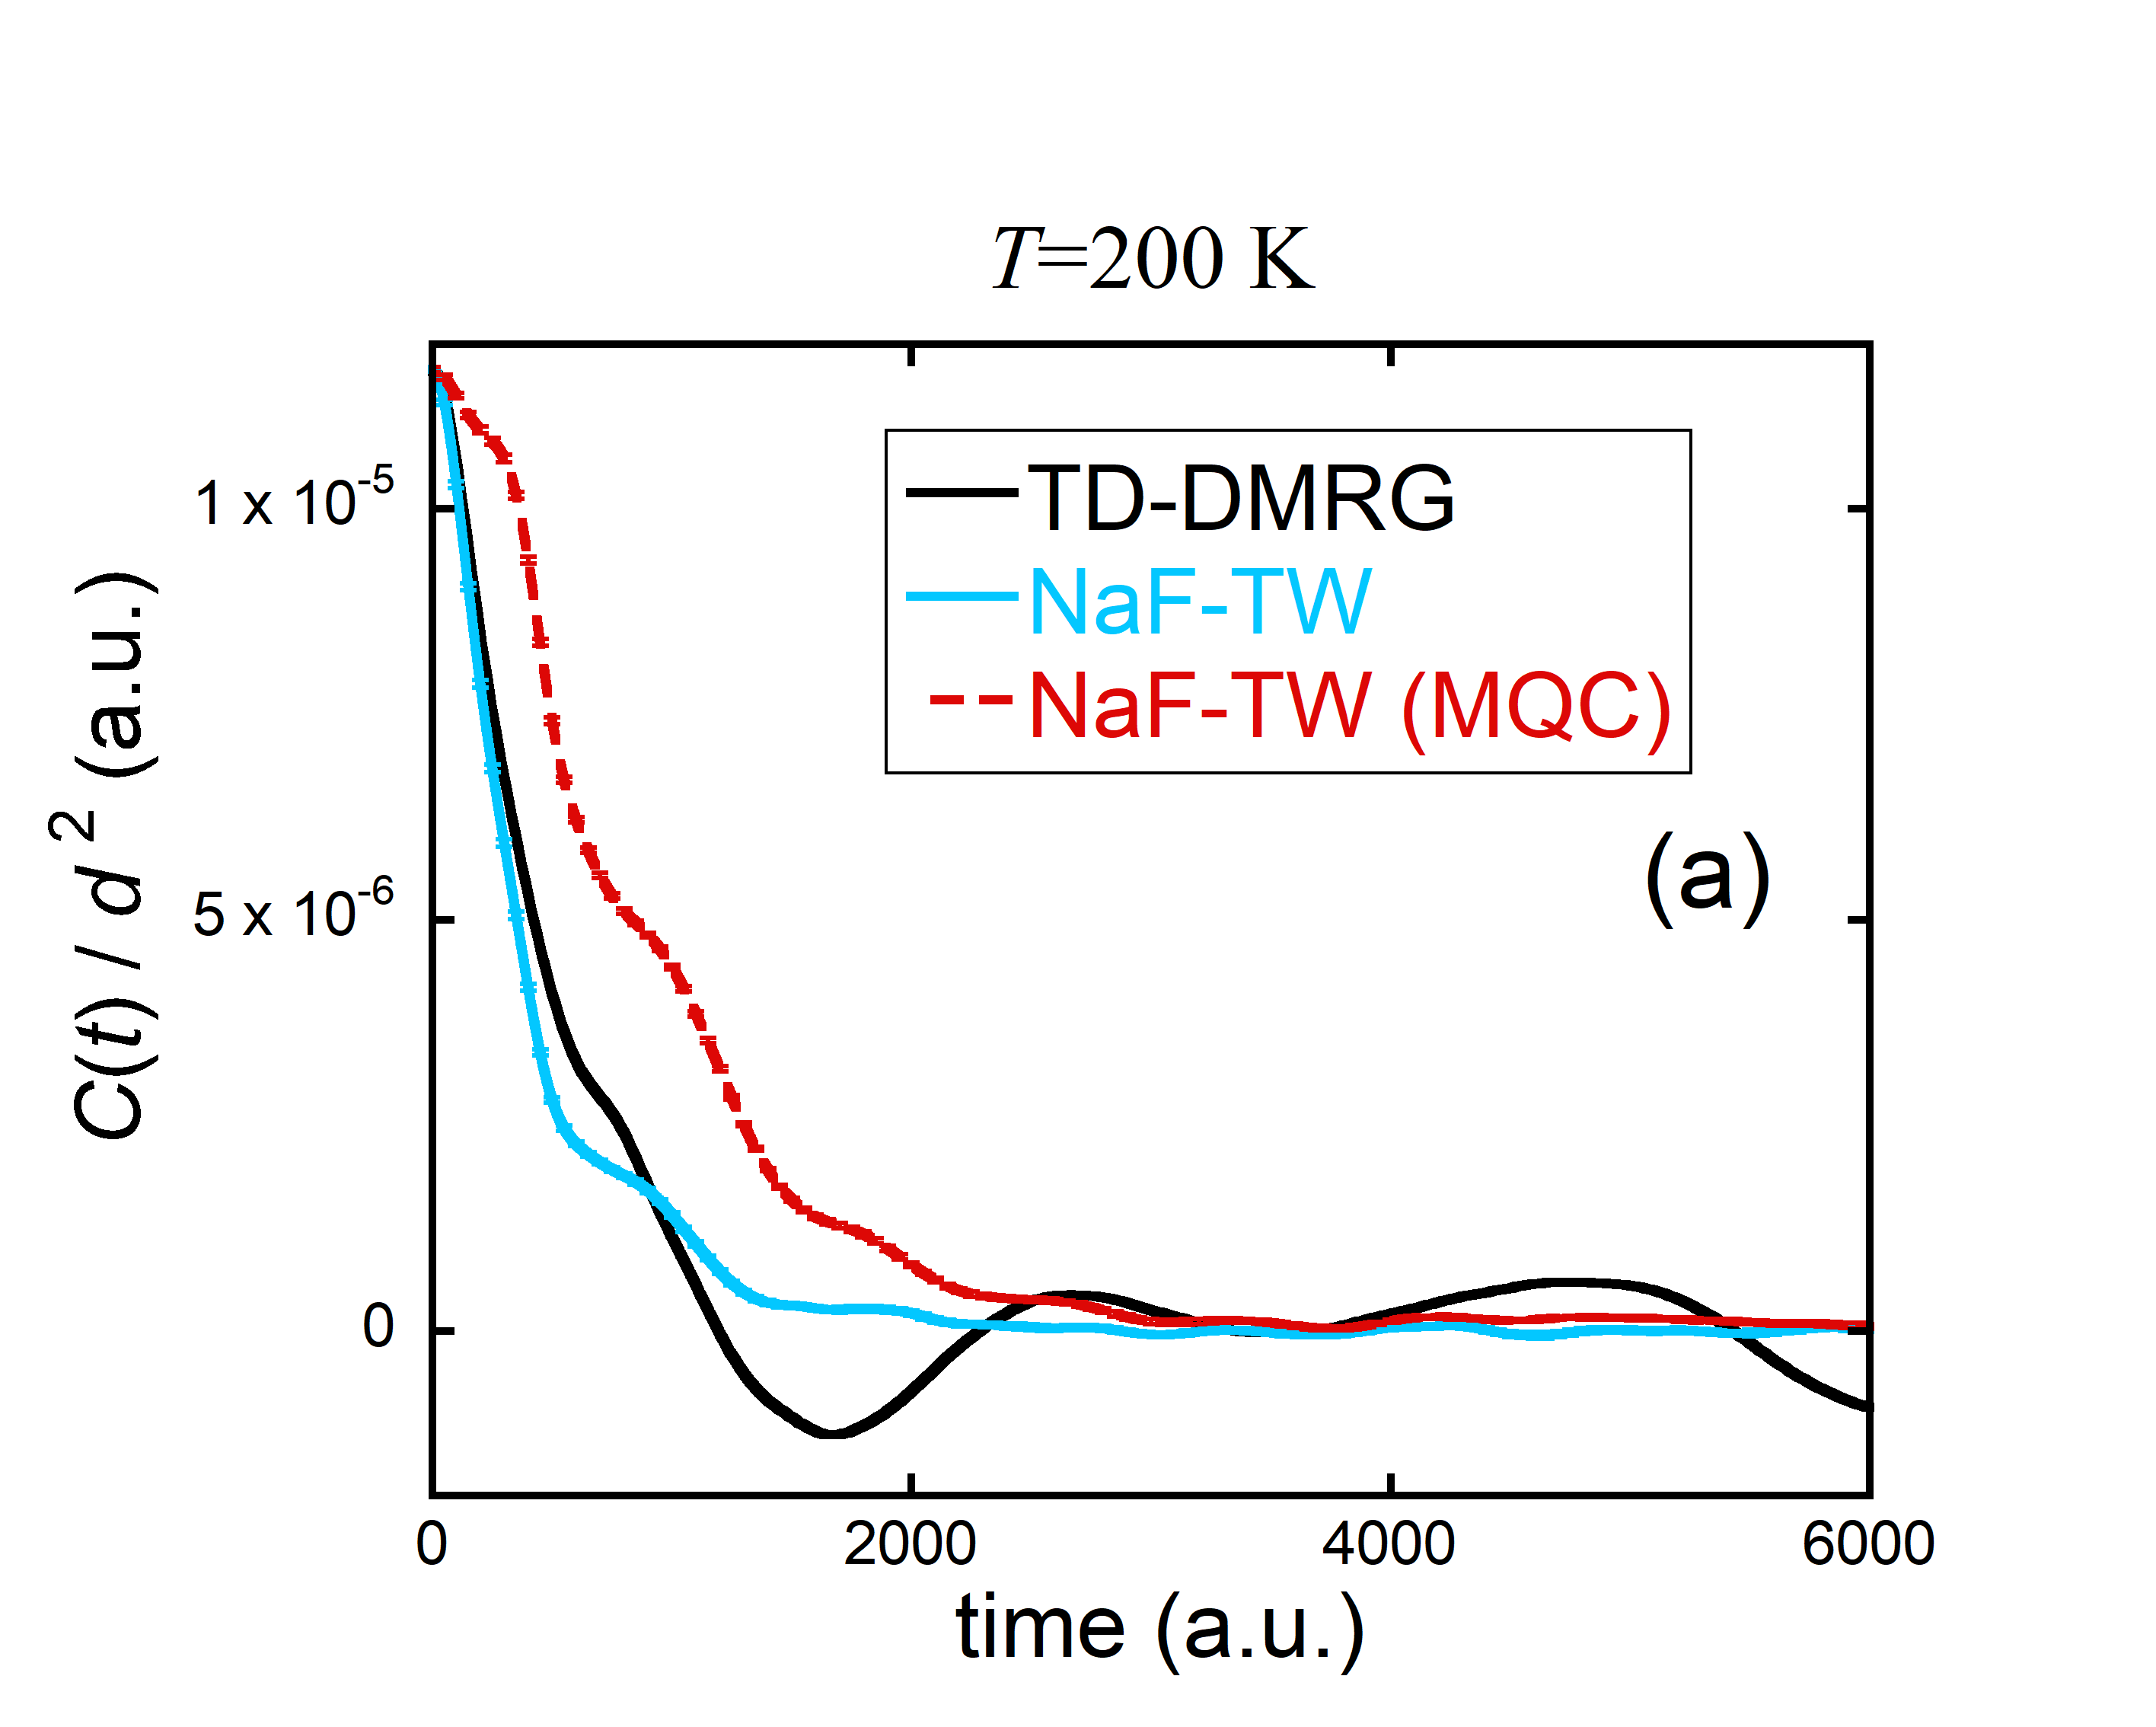
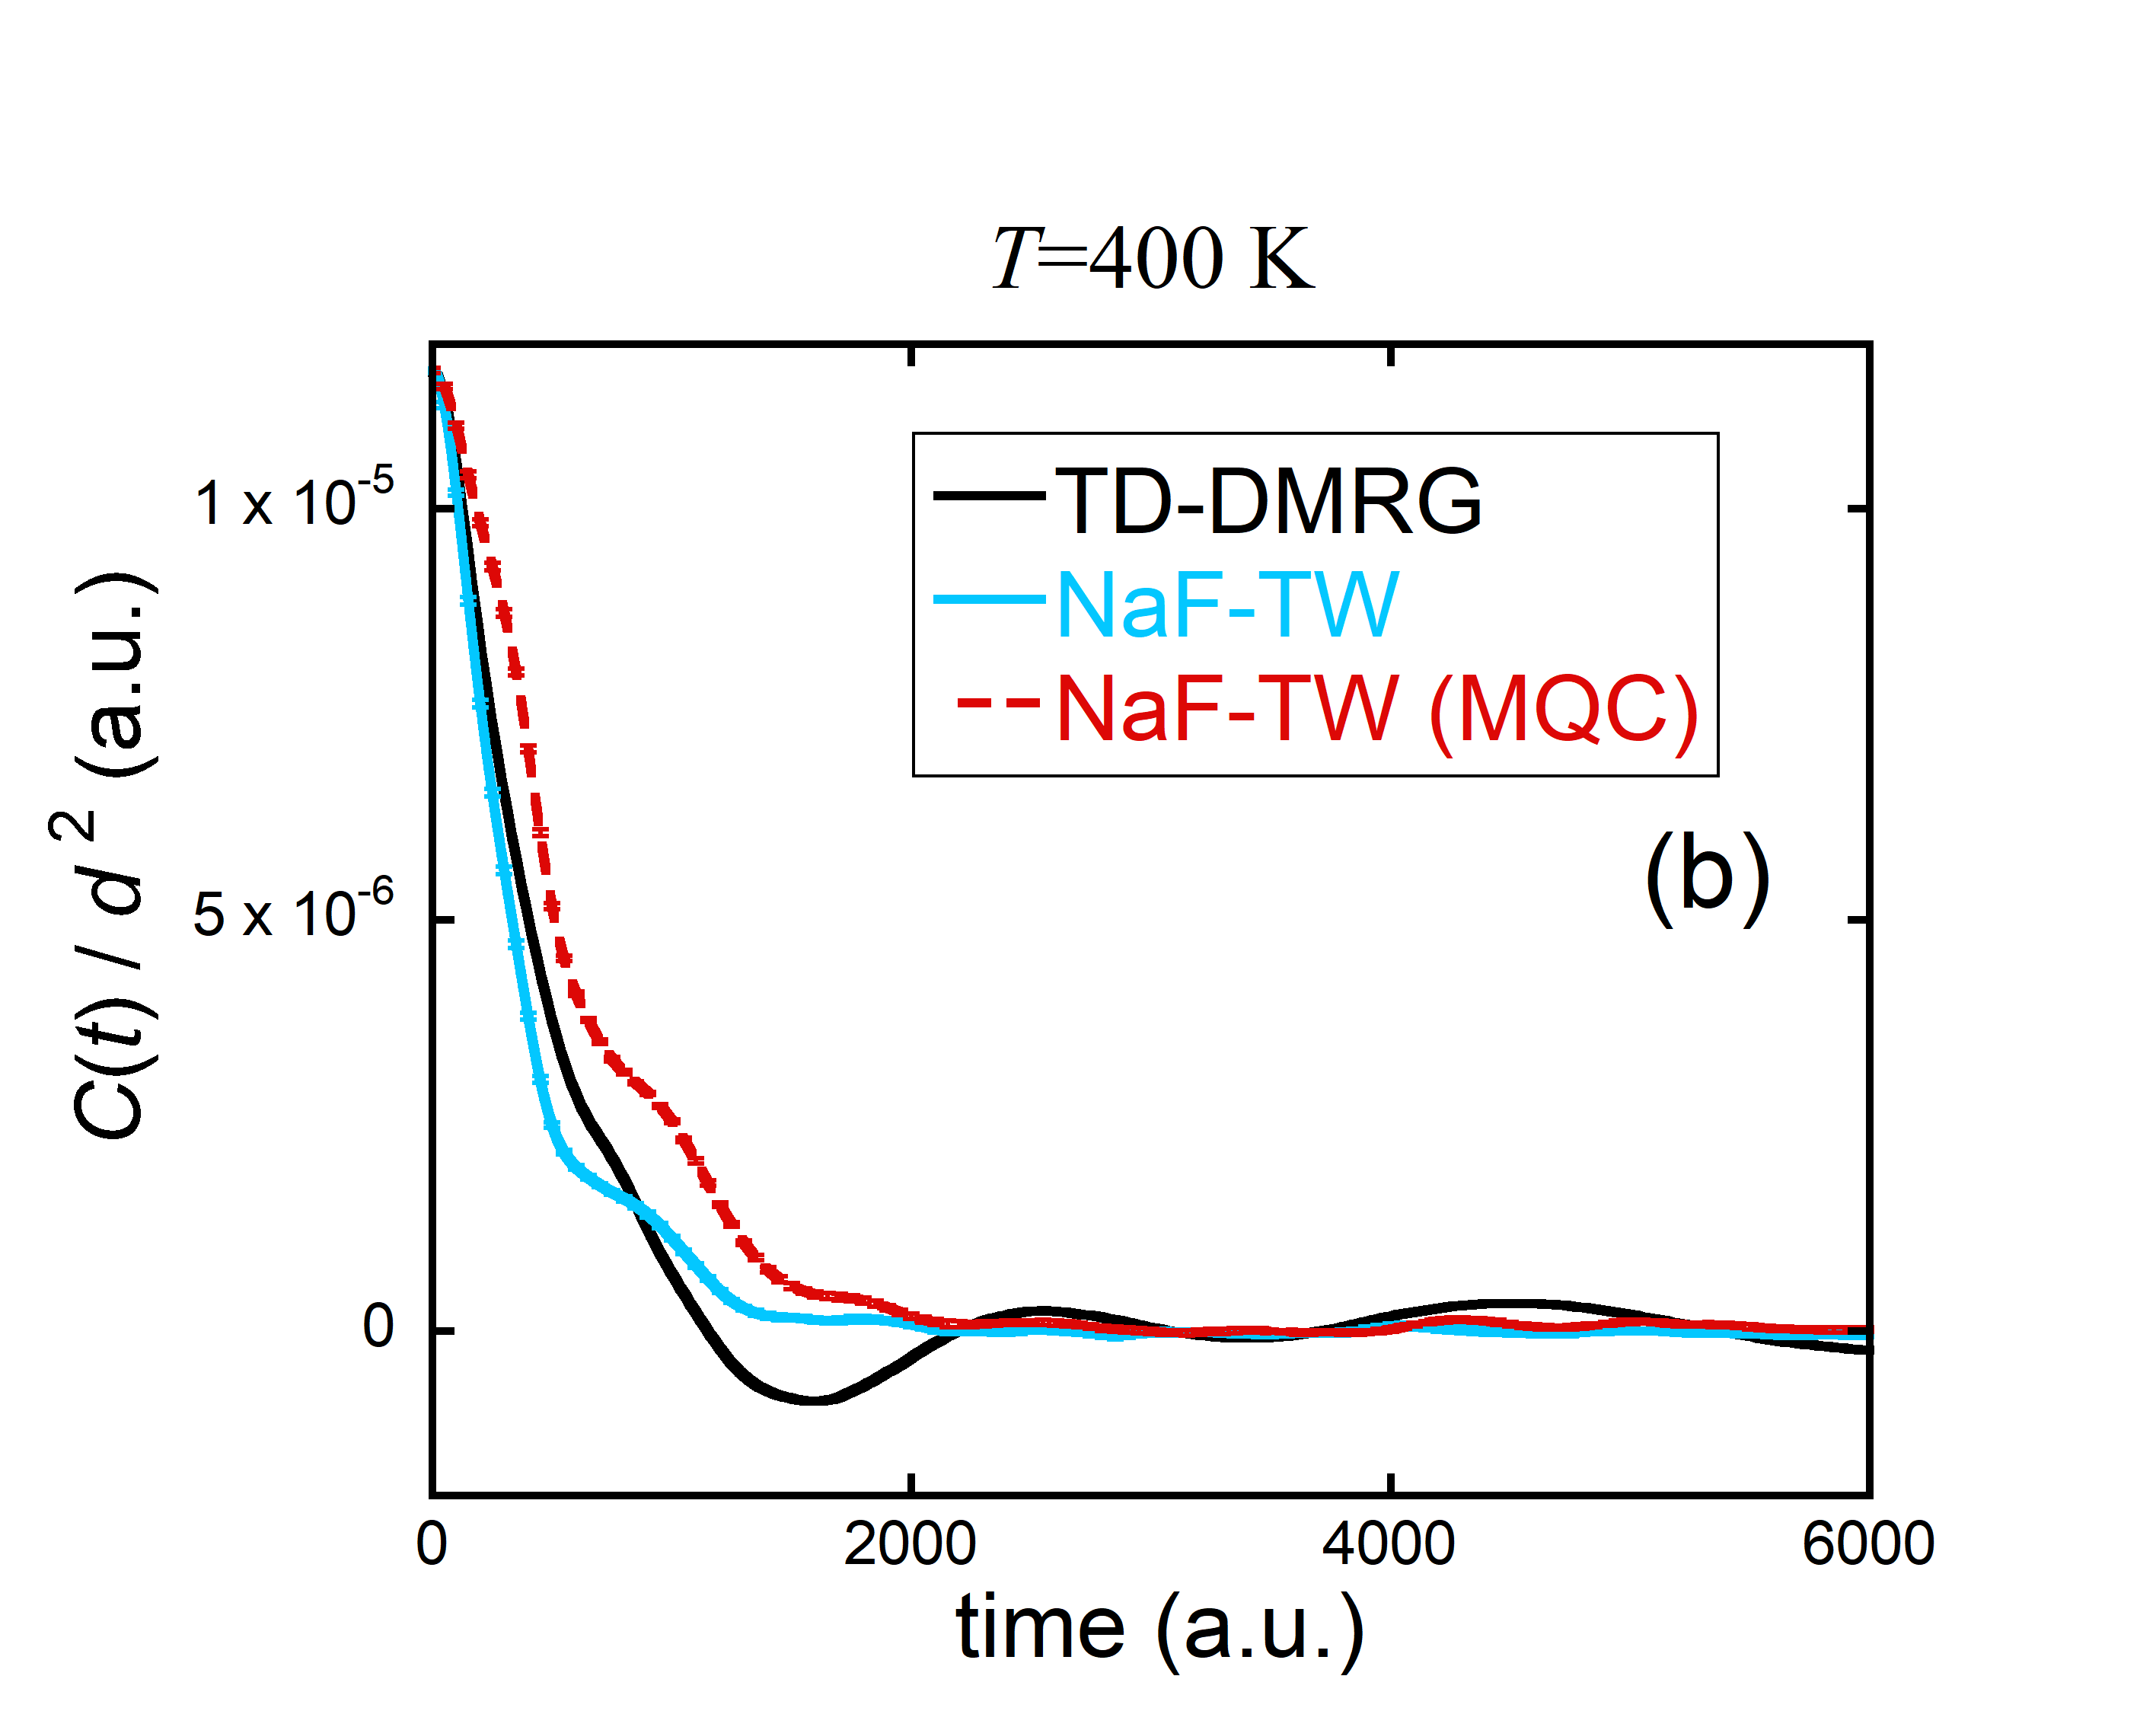
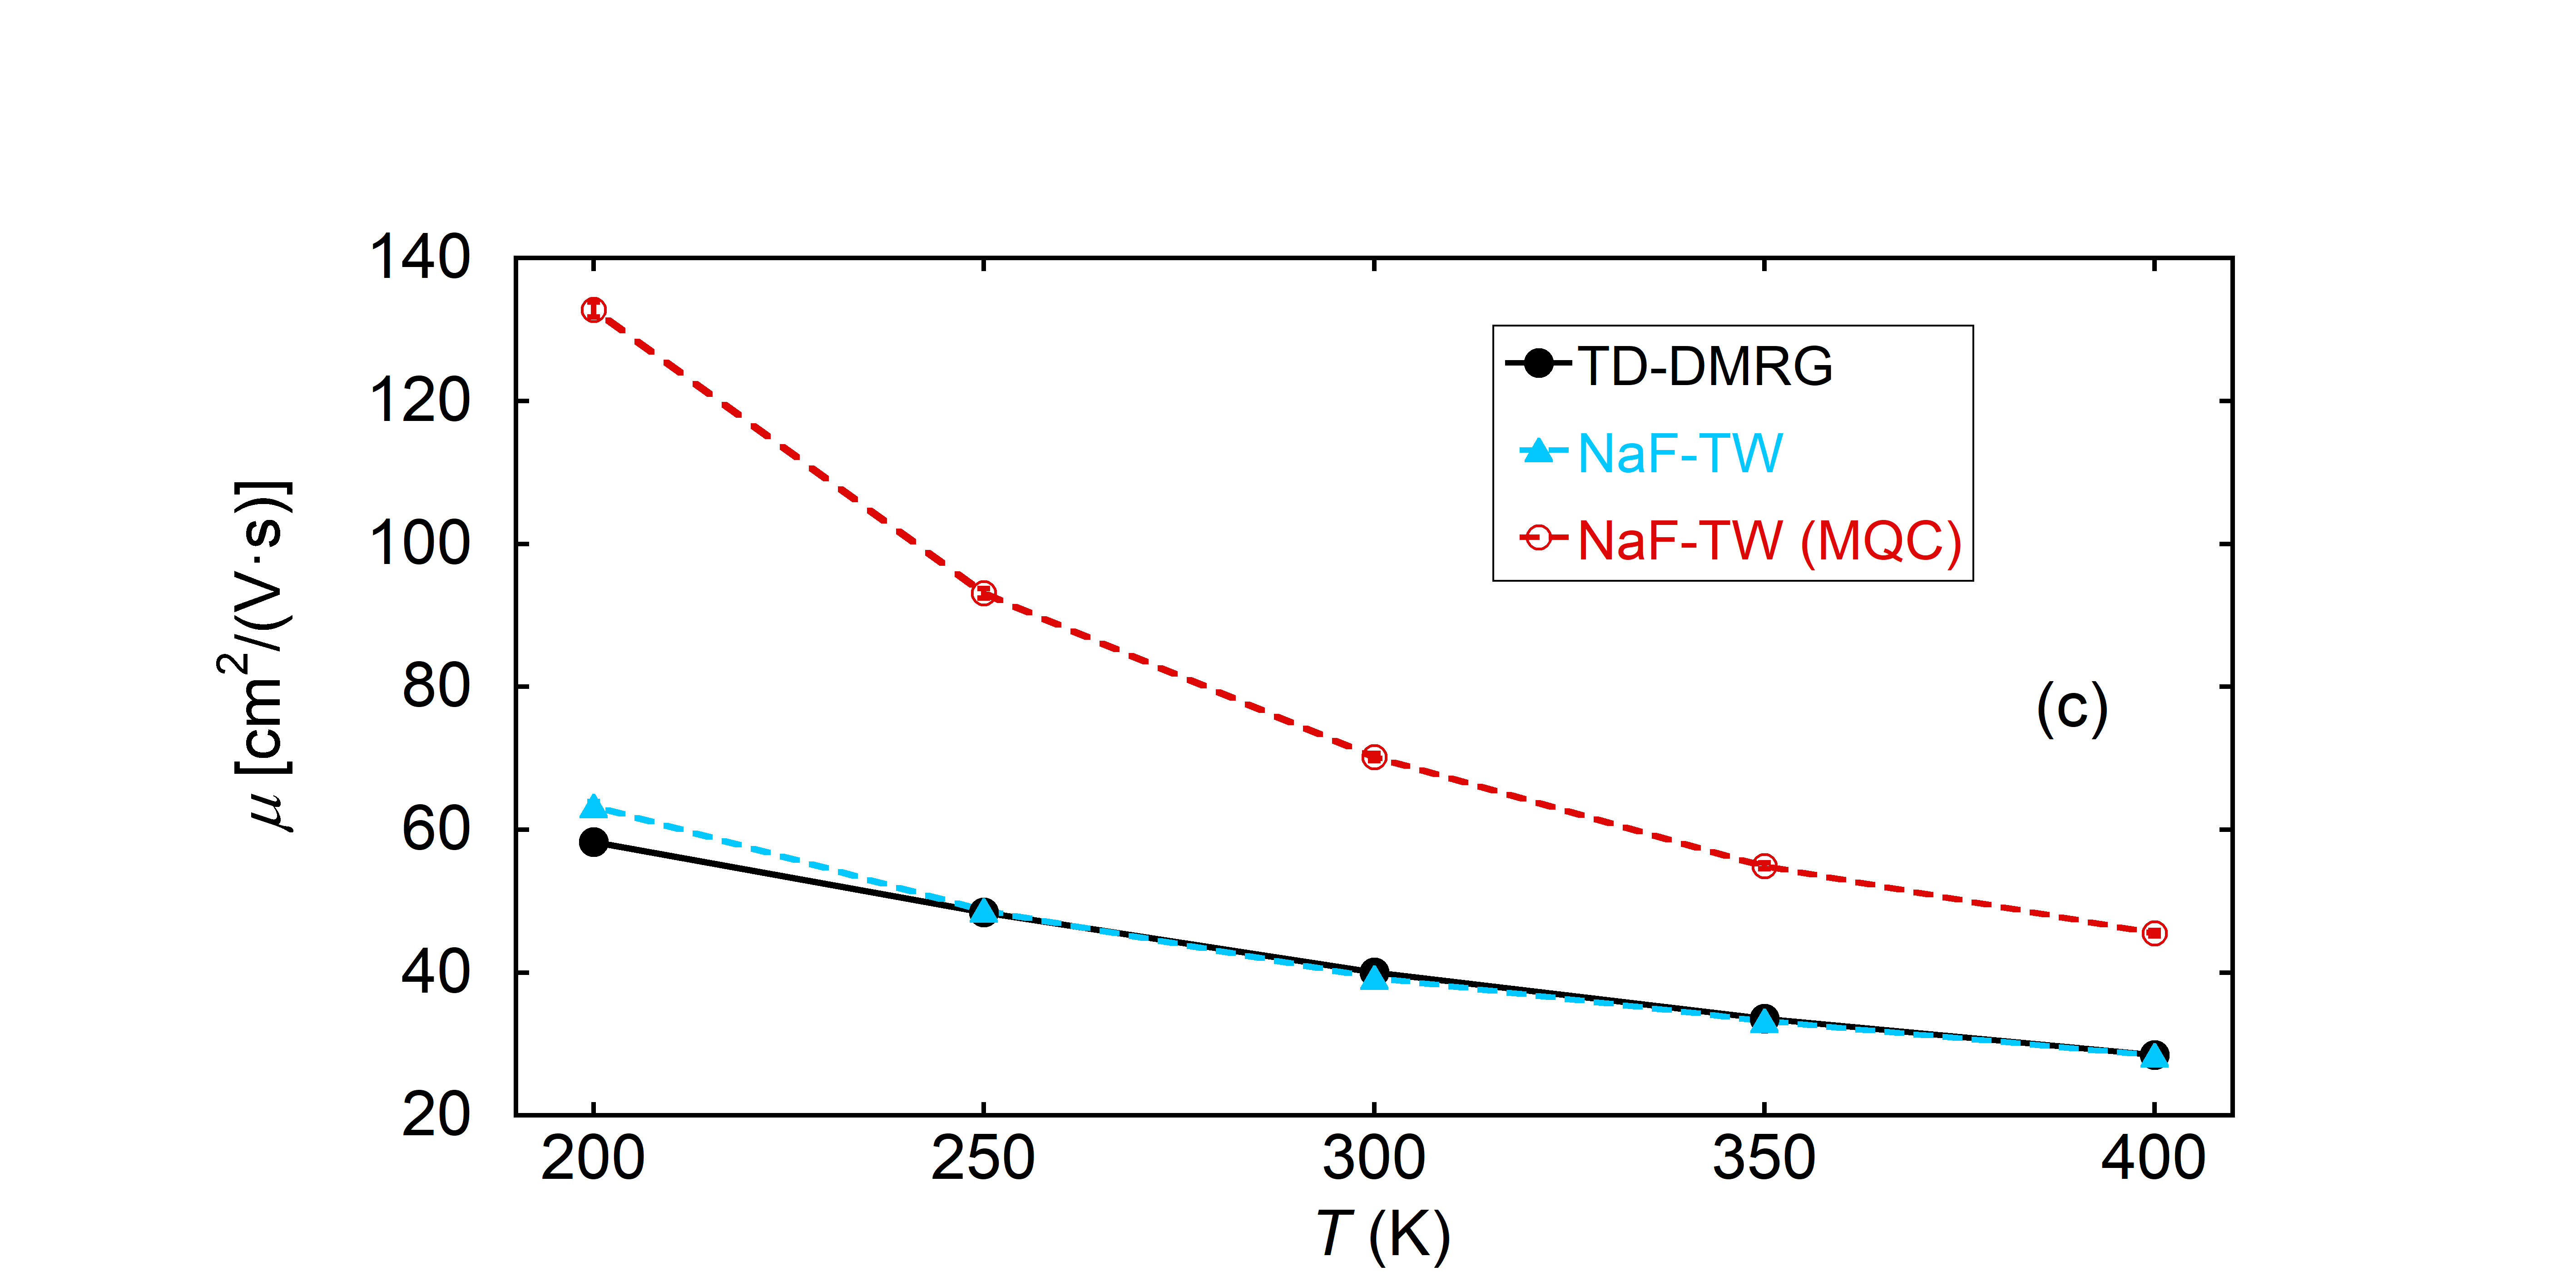
Figure S2. Panels (a)-(b):