Tully models
The following figures and data are our benchmarking results (for detailed discussion please see ref1).
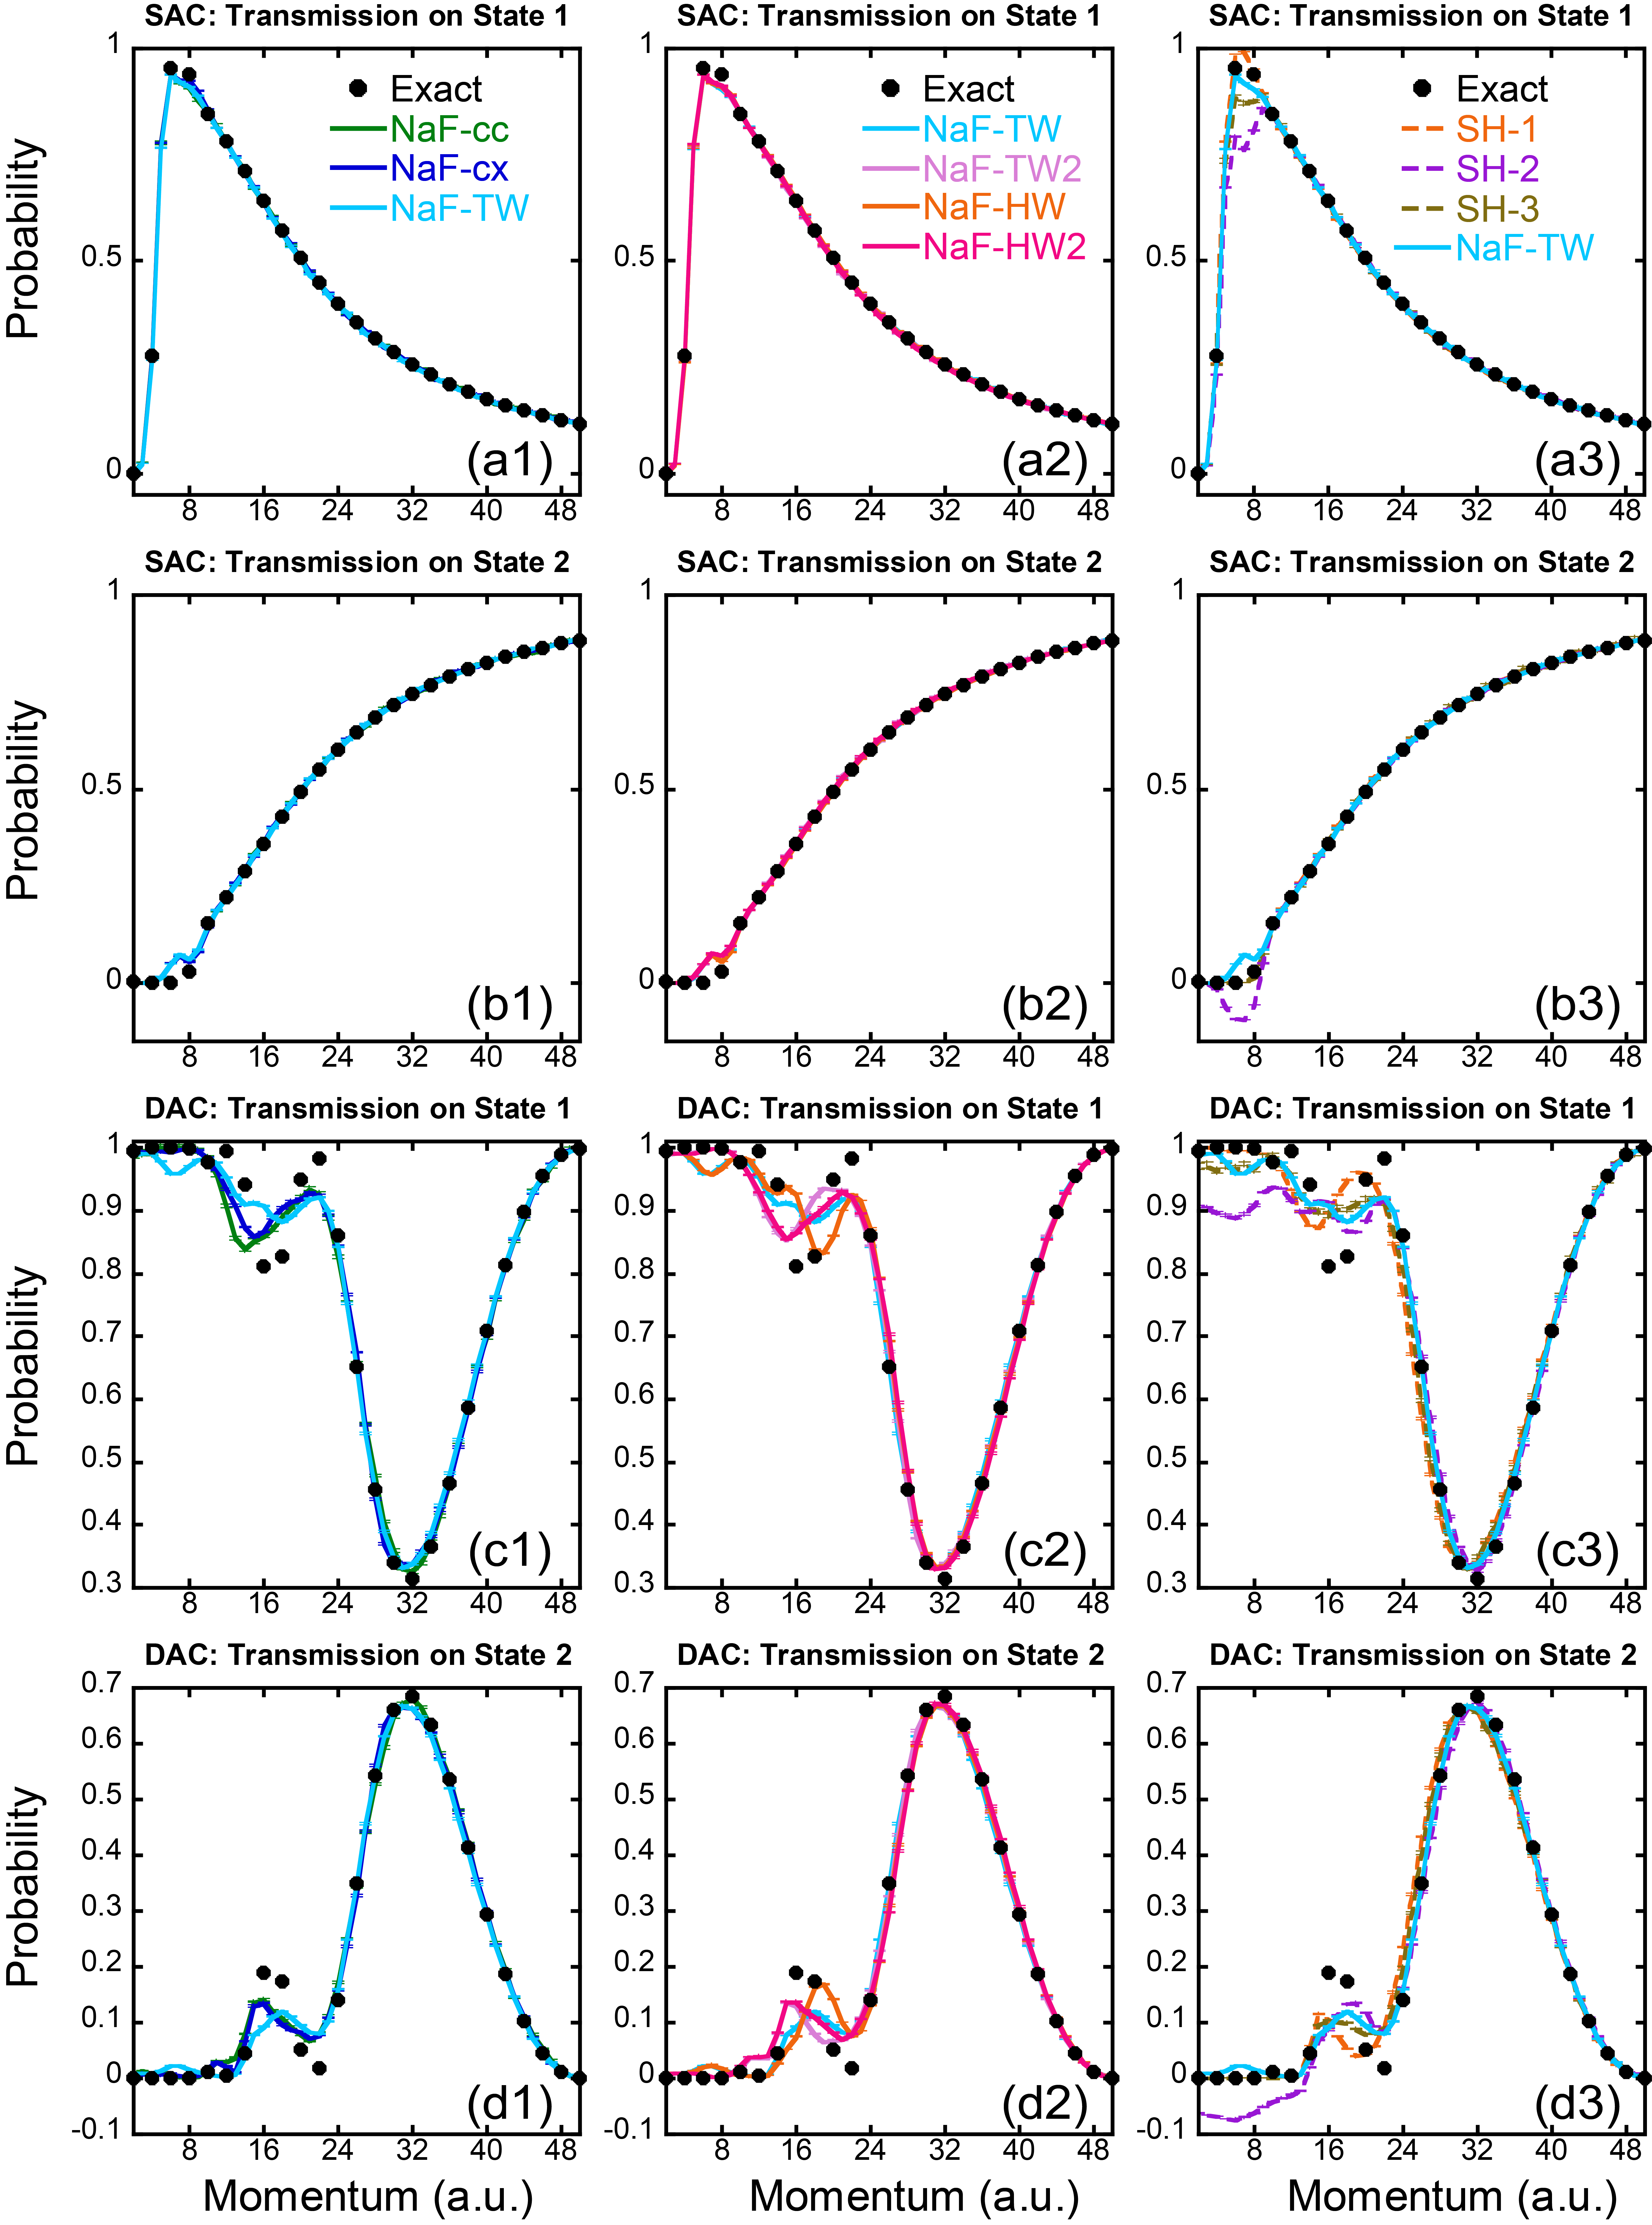
Figure 5. Results of the SAC and DAC models. Panels (a1) and (b1): transmission probabilities on the adiabatic ground and excited state of the SAC model, respectively. Panels (c1) and (d1): transmission probabilities on the adiabatic ground and excited state of the DAC model, respectively. In panels (a1), (b1), (c1) and (d1), the green, blue, and cyan solid lines represent the results of NaF-cc, NaF-cx and NaF-TW, respectively. Panels (a2), (b2), (c2) and (d2) are similar to panels (a1), (b1), (c1) and (d1), respectively, but the cyan, pink, orange and magenta solid lines denote the results of NaF-TW, NaF-TW2, NaF-HW and NaF-HW2, respectively. Panels (a3), (b3), (c3) and (d3) are similar to panels (a1), (b1), (c1) and (d1), respectively, but the orange dashed lines, purple dashed lines, brown dashed lines and cyan solid lines denote the results of SH-1, SH-2, SH-3 and NaF-TW, respectively. The numerically exact results produced by DVR2 are demonstrated by black points in each panel. data
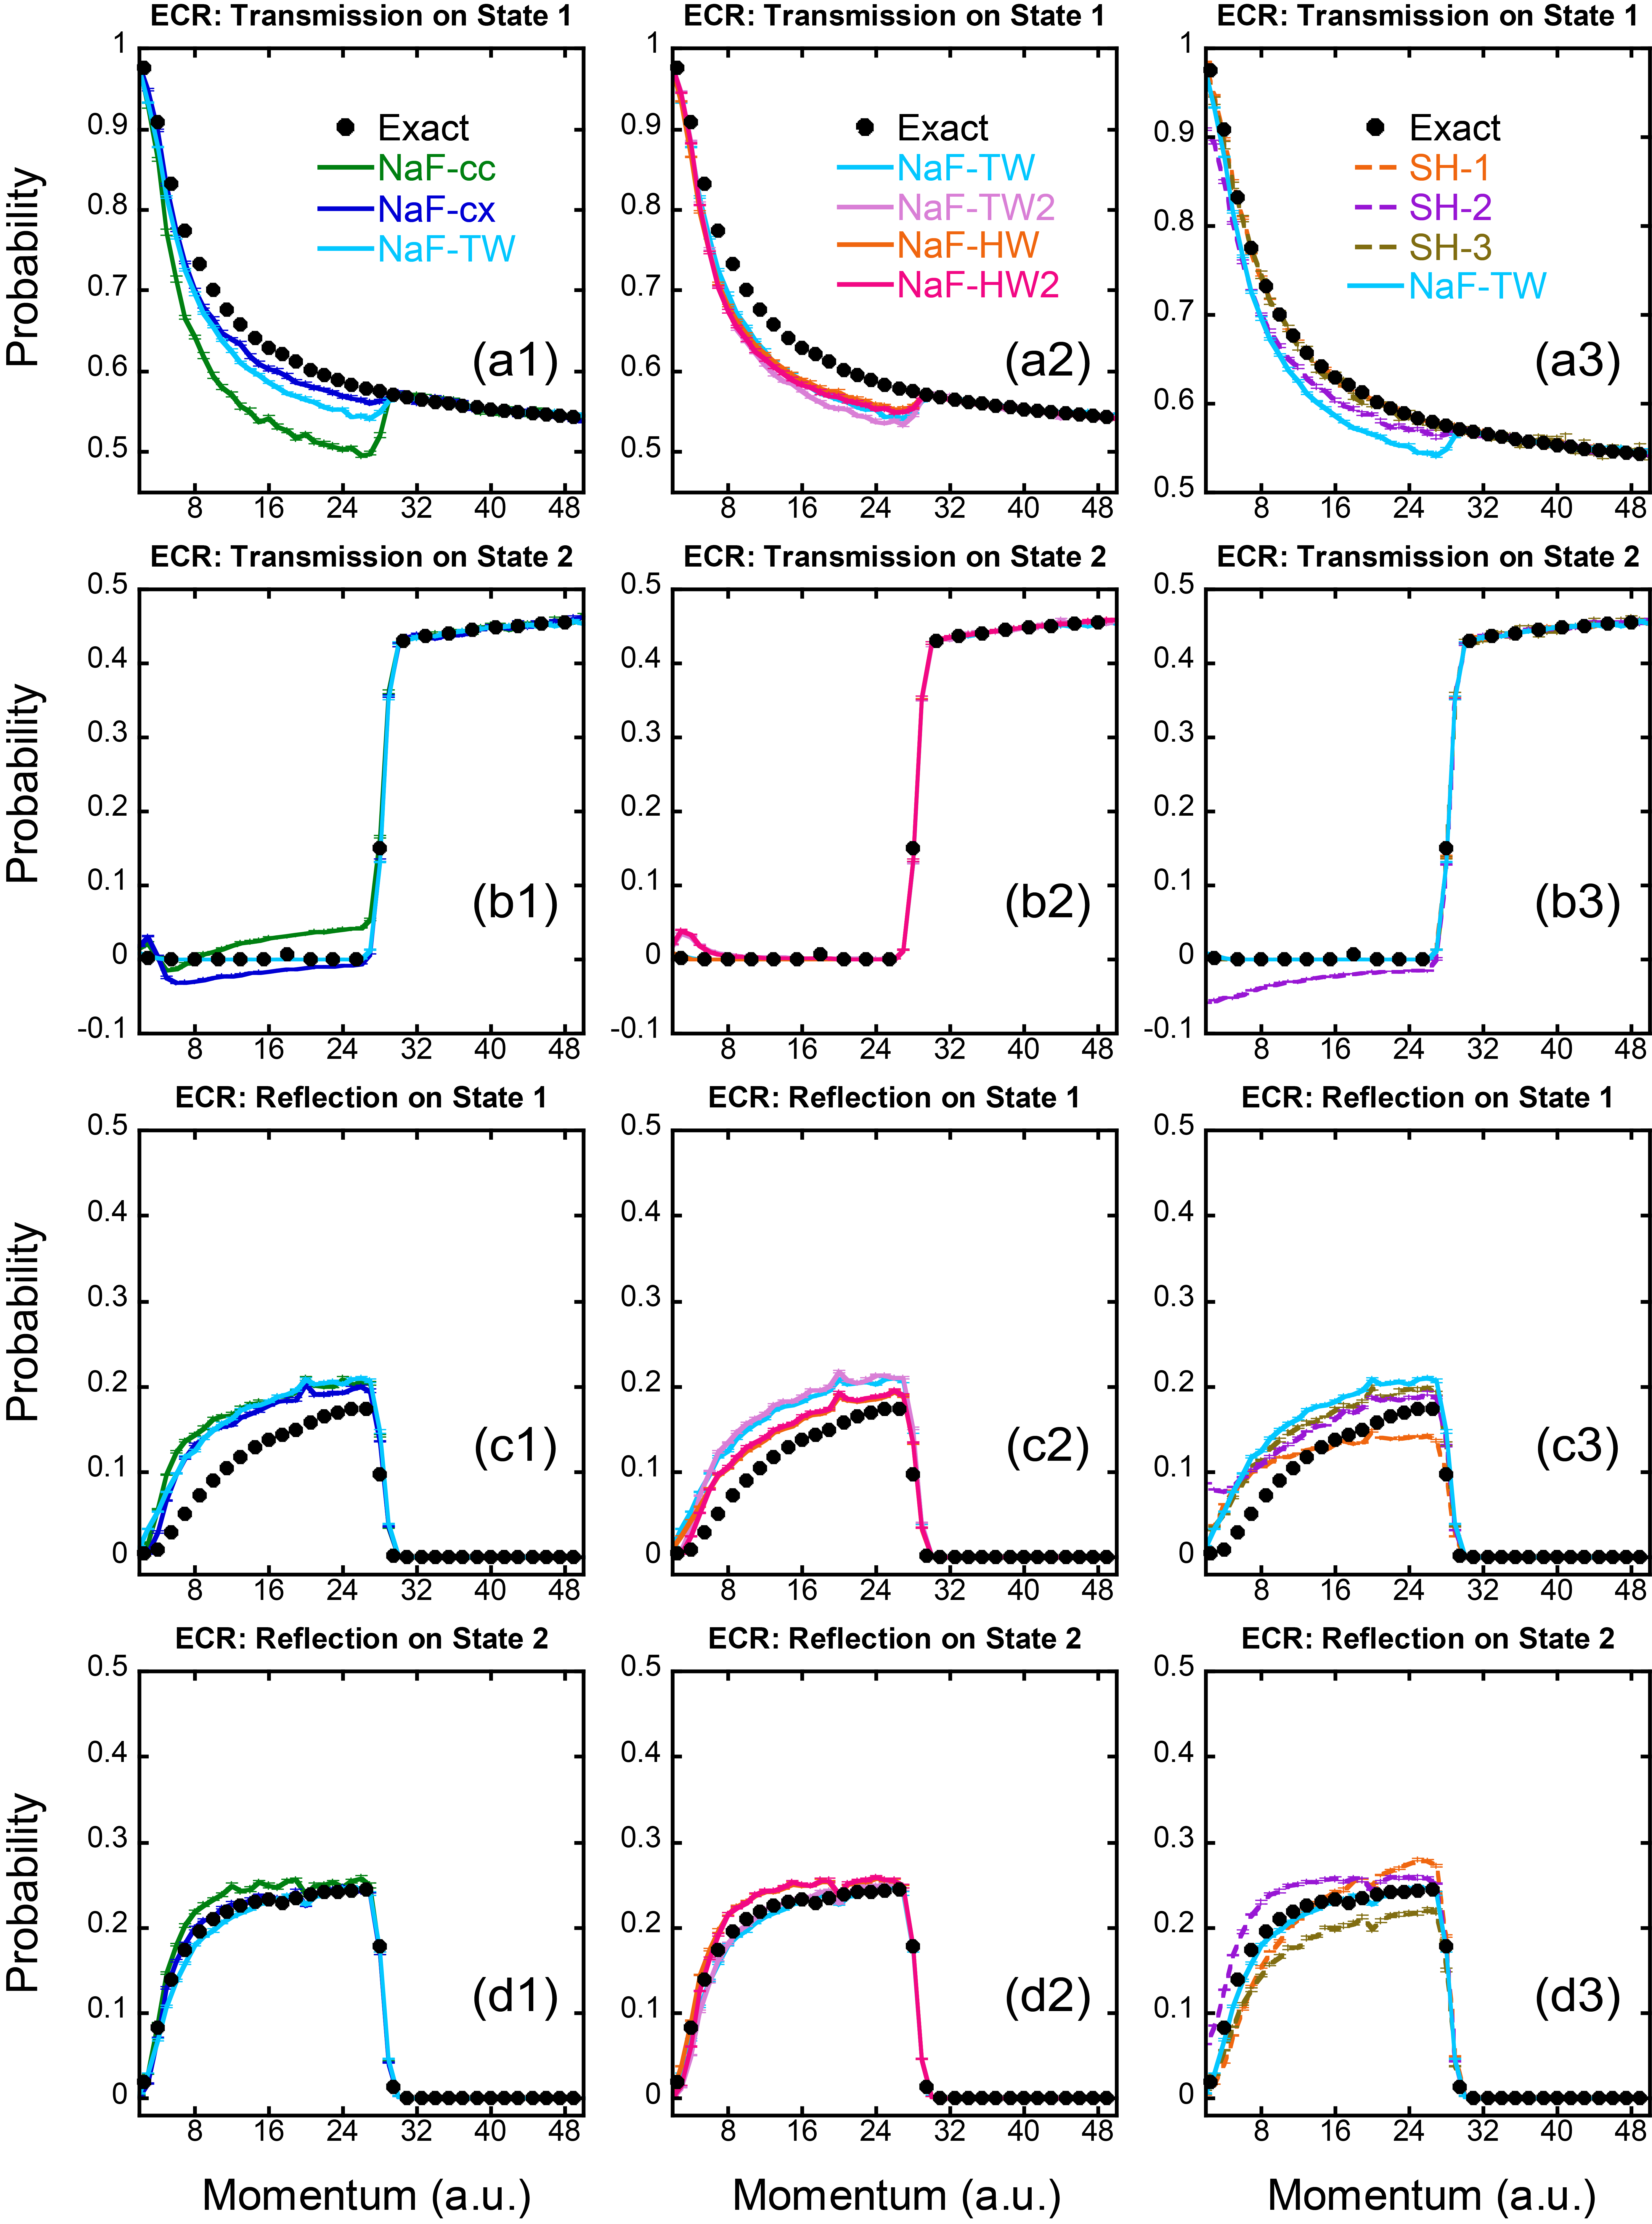
Figure 6. Results of the ECR models. Panels (a1) and (b1): transmission probabilities on the adiabatic ground and excited state, respectively. Panels (c1) and (d1): reflection probabilities on the adiabatic ground and excited state, respectively. In panels (a1), (b1), (c1) and (d1), the green, blue, and cyan solid lines represent the results of NaF-cc, NaF-cx and NaF-TW, respectively. Panels (a2), (b2), (c2) and (d2) are similar to panels (a1), (b1), (c1) and (d1), respectively, but the cyan, pink, orange and magenta solid lines denote the results of NaF-TW, NaF-TW2, NaF-HW and NaF-HW2, respectively. Panels (a3), (b3), (c3) and (d3) are similar to panels (a1), (b1), (c1) and (d1), respectively, but the orange dashed lines, purple dashed lines, brown dashed lines and cyan solid lines denote the results of SH-1, SH-2, SH-3 and NaF-TW, respectively. The numerically exact results produced by DVR2 are demonstrated by black points in each panel. data
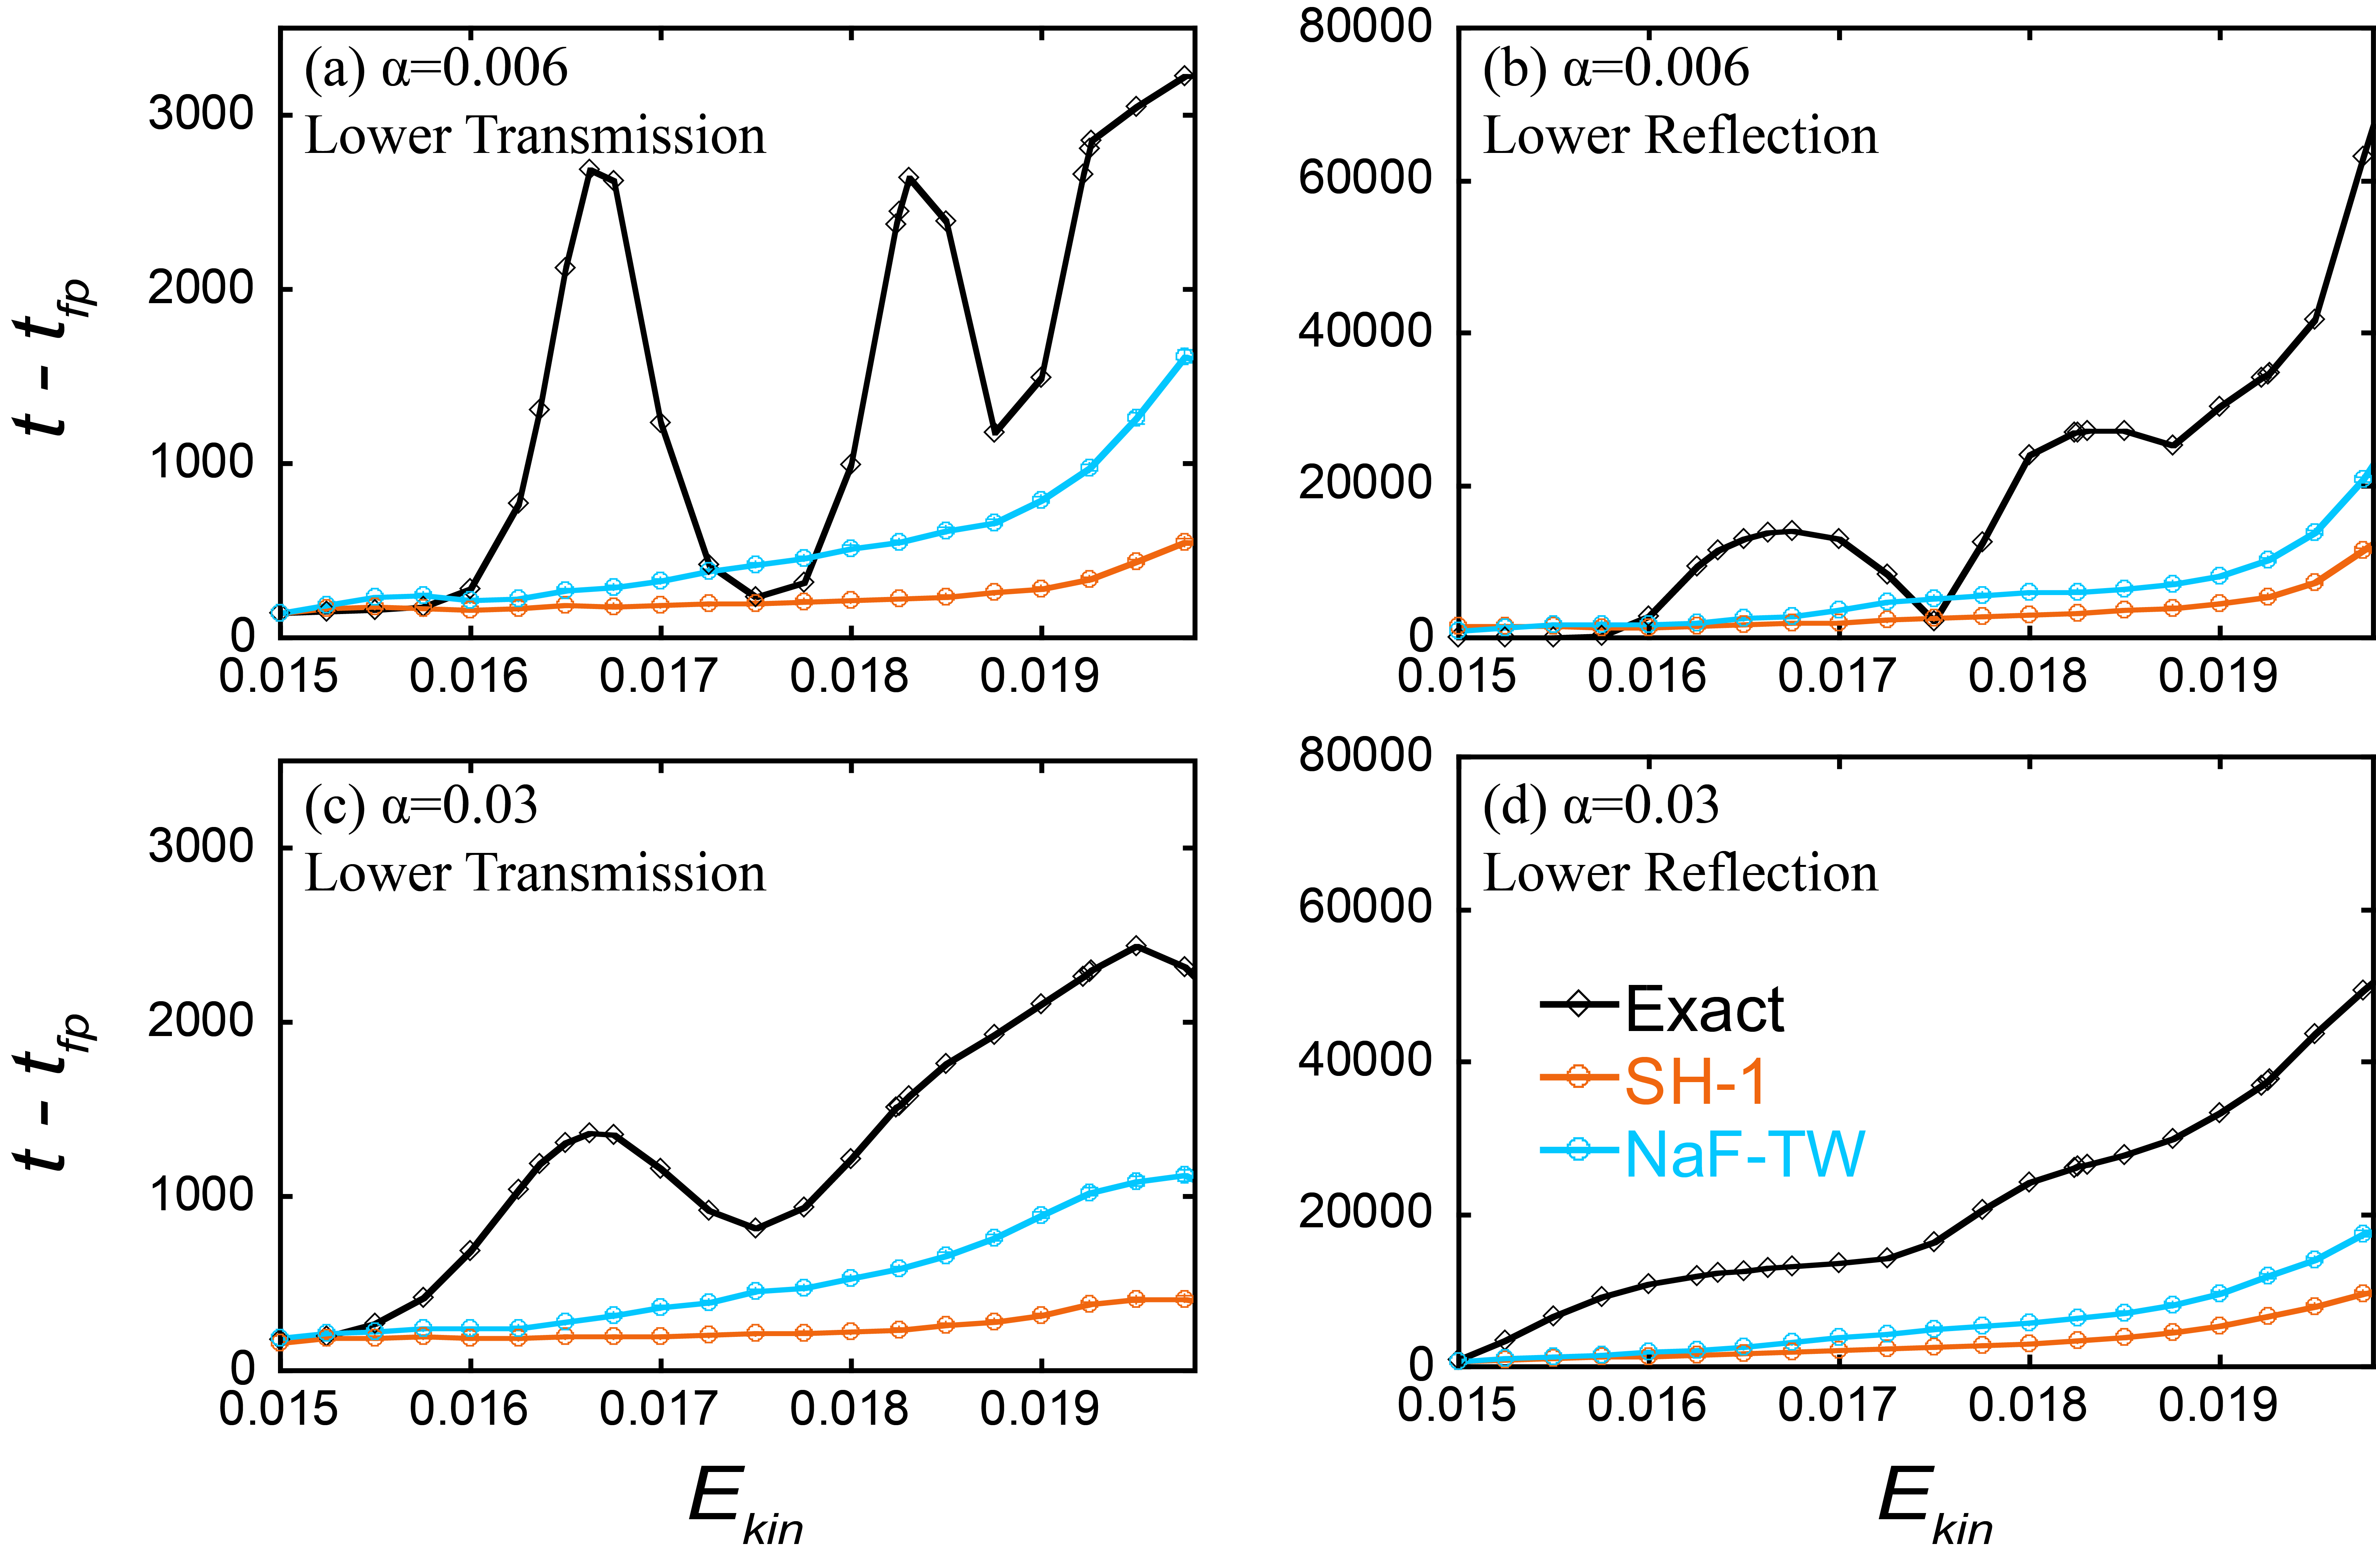
Figure S7. Results of the mean flight time difference of the SAC model as a function of the initial mean kinetic energy are illustrated. Panels (a) and (b) illustrate the transmission and reflection results on the adiabatic ground state with width parameter