3-state photodissociation models
The following figures and data are our benchmarking results (for detailed discussion please see ref1).
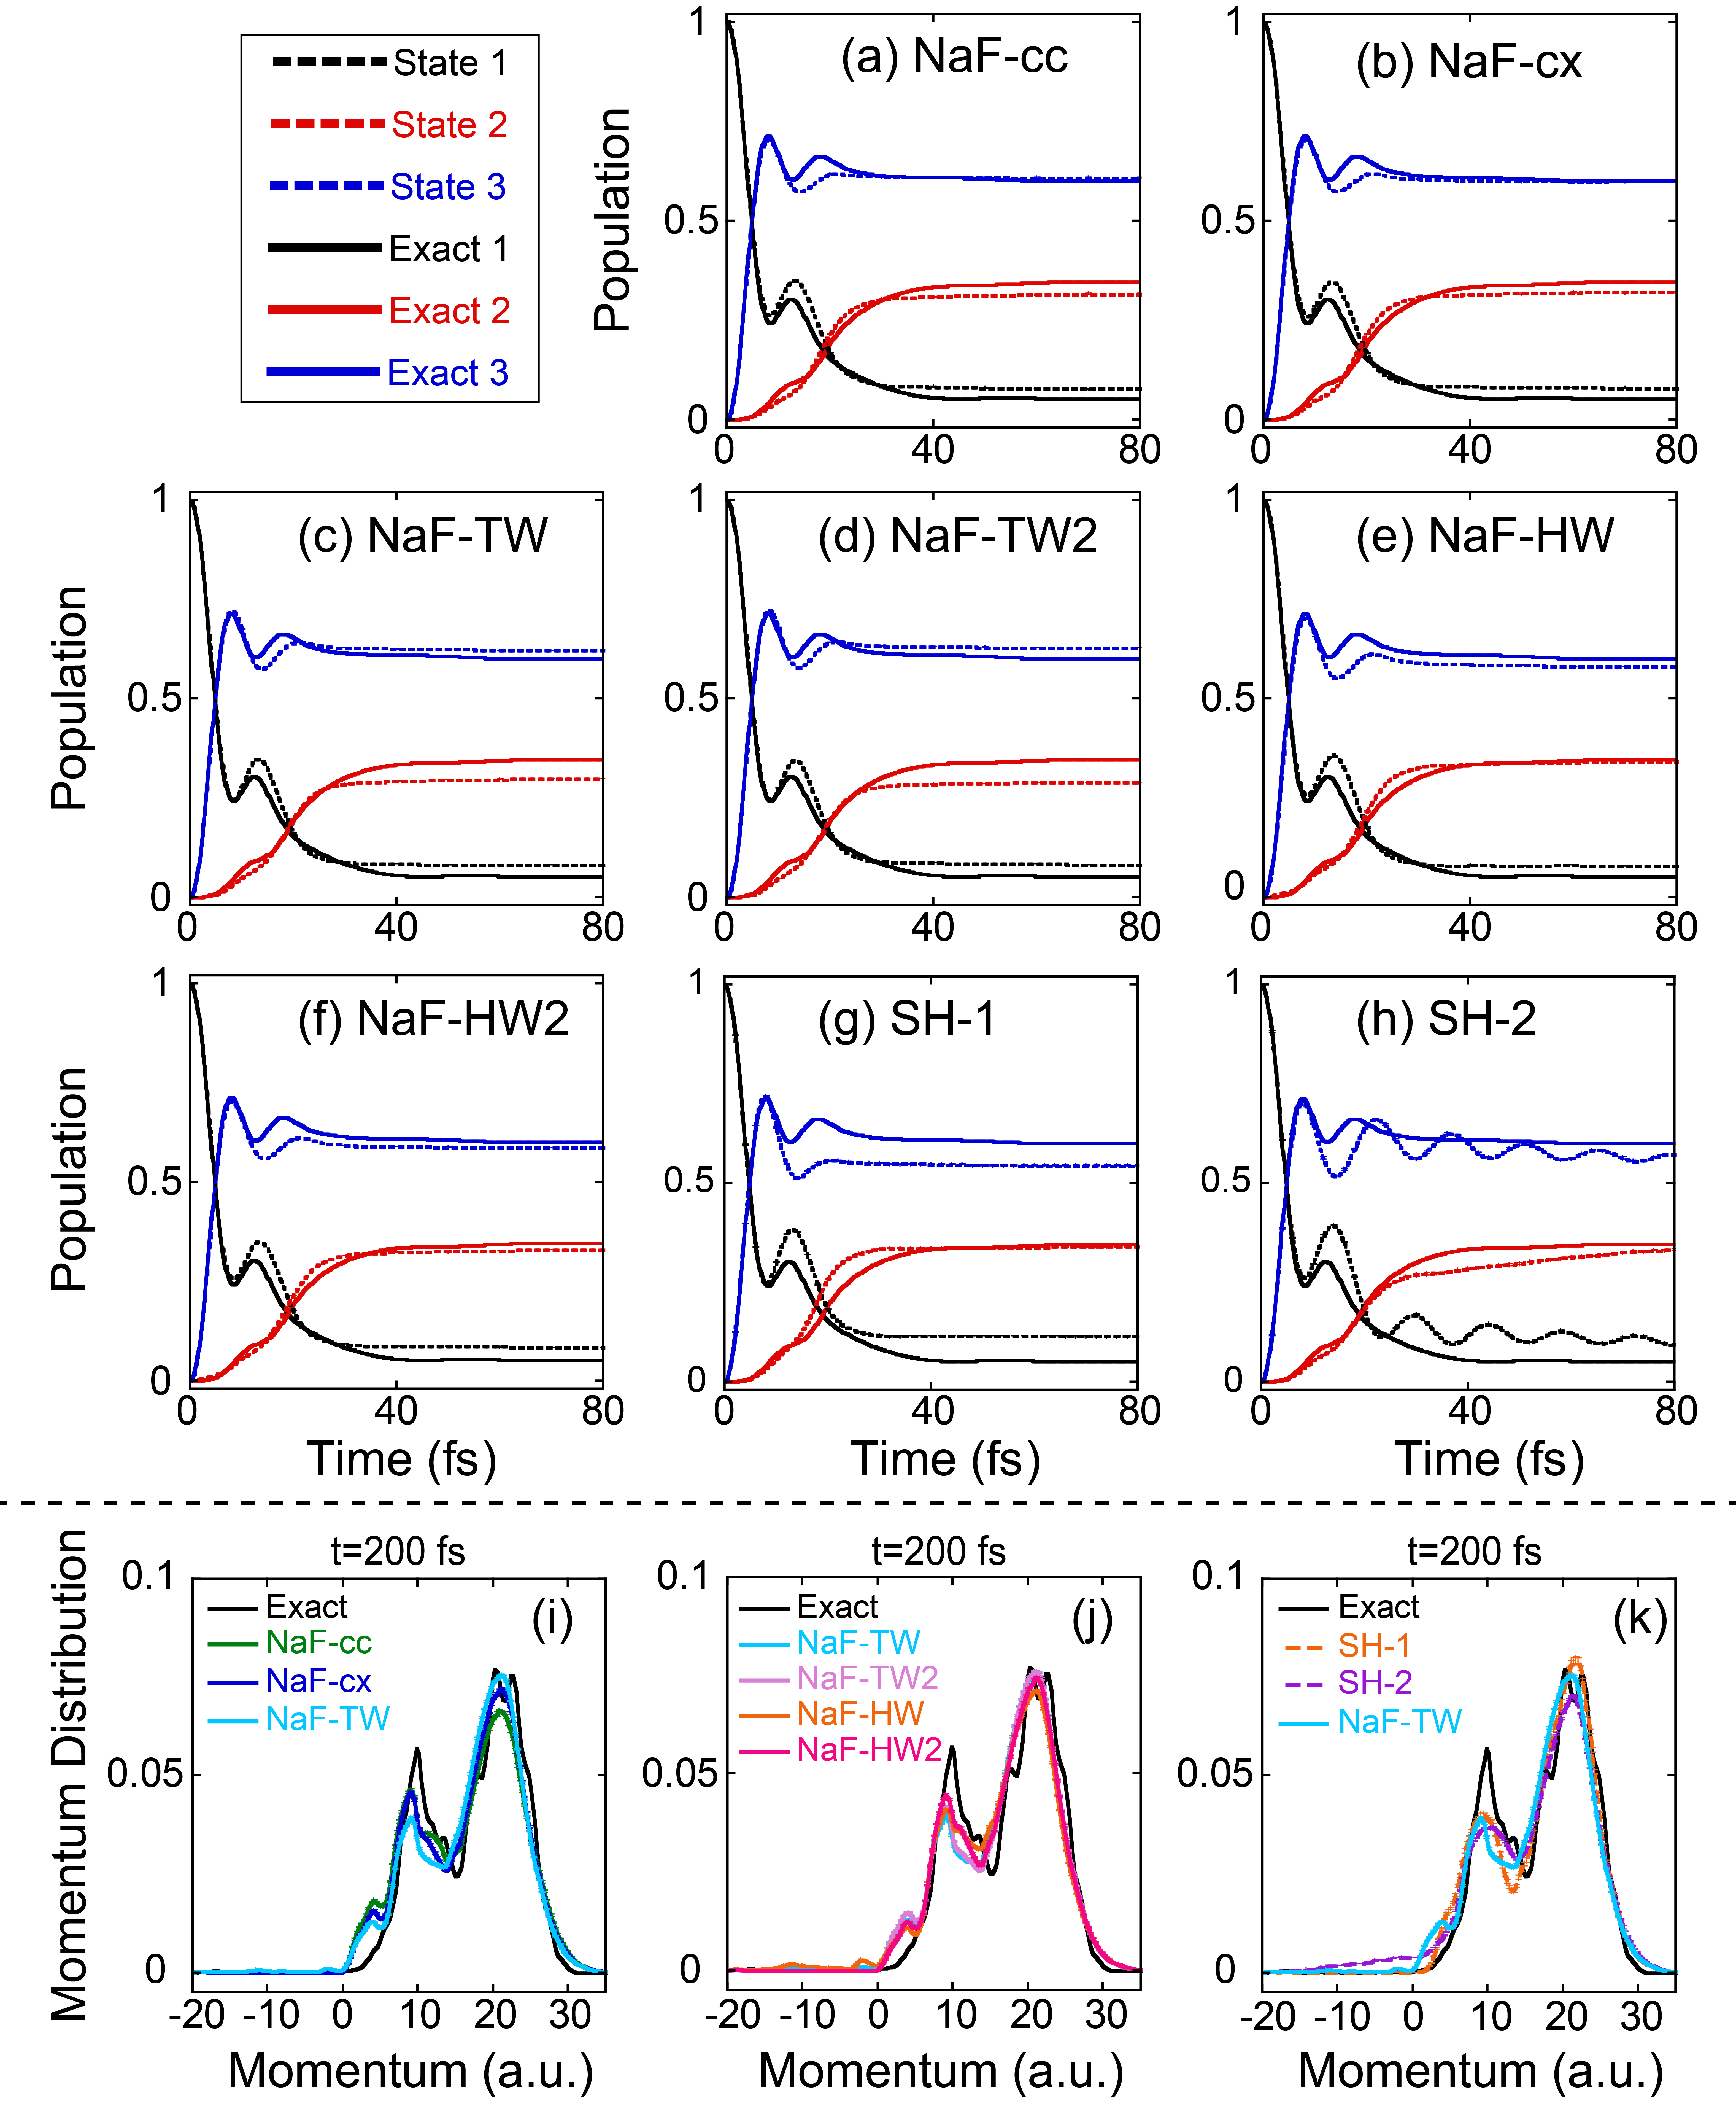
Figure 7. Results of Model 2 of the 3-state photodissociation models. In panels (a)-(h), the black, red and blue dashed lines represent population dynamics of states 1−3, respectively. Panel (a): NaF-cc. Panel (b): NaF-cx. Panel (c): NaF-TW. Panel (d): NaF-TW2. Panel (e): NaF-HW. Panel (f) NaF-HW2. Panel (g): SH-1. Panel (h): SH-2. Note that SH-3 is not applicable for this 3-state model. The numerically exact results produced by DVR2 are demonstrated by solid lines with corresponding colors in panels (a)-(h). Panels (i)-(k) illustrate the nuclear momentum distribution at 200 fs. The green, blue, and cyan solid lines in panel (i) represent the results of NaF-cc, NaF-cx and NaF-TW, respectively. The cyan, pink, orange and magenta solid lines in panel (j) denote the results of NaF-TW, NaF-TW2, NaF-HW and NaF-HW2, respectively. The orange dashed lines, purple dashed lines and cyan solid lines in panel (k) denote the results of SH-1, SH-2 and NaF-TW, respectively. The black solid lines in panels (i)-(k) denote the numerically exact results produced by DVR2. data
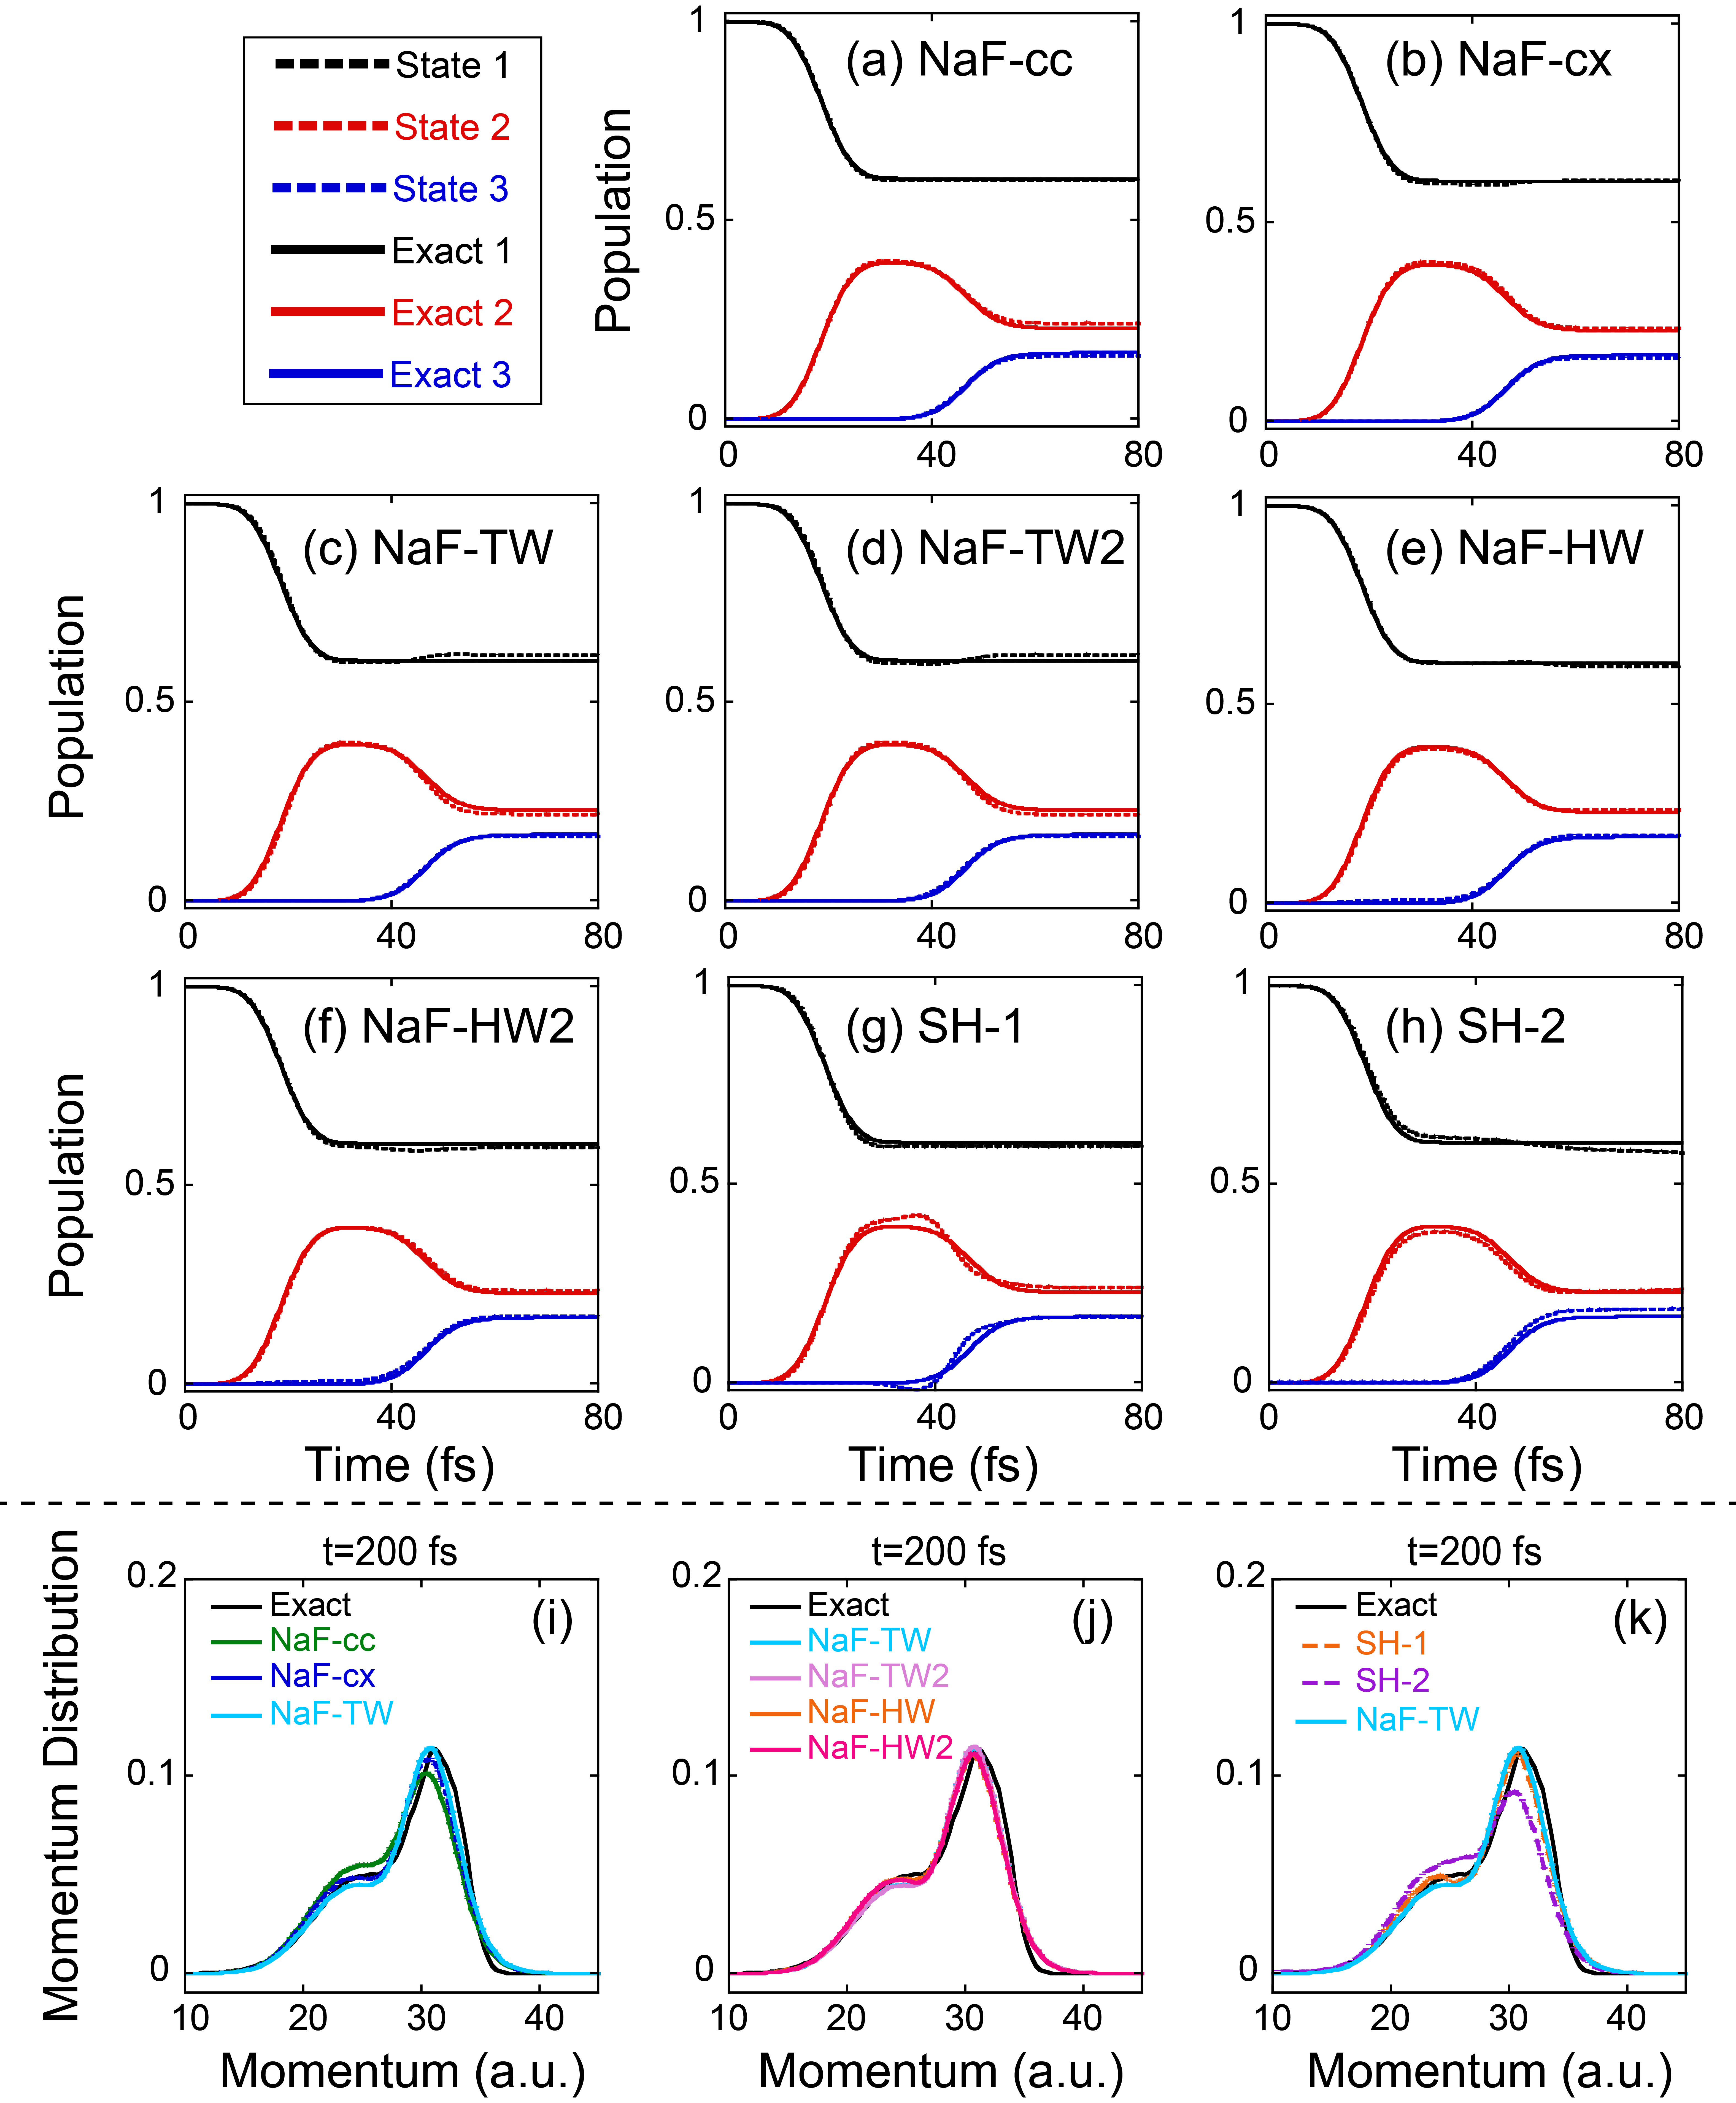
Figure S3. Results of Model 1 of the 3-state photodissociation models. In panels (a)-(h), the black, red and blue dashed lines represent population dynamics of states 1−3, respectively. Panel (a): NaF-cc. Panel (b): NaF-cx. Panel (c): NaF-TW. Panel (d): NaF-TW2. Panel (e): NaF-HW. Panel (f) NaF-HW2. Panel (g): SH-1. Panel (h): SH-2. Note that SH-3 is not applicable for this 3-state model. The numerically exact results produced by DVR2 are demonstrated by solid lines with corresponding colors in panels (a)-(h). Panels (i)-(k) illustrate the nuclear momentum distribution at 200 fs. The green, blue, and cyan solid lines in panel (i) represent the results of NaF-cc, NaF-cx and NaF-TW, respectively. The cyan, pink, orange and magenta solid lines in panel (j) denote the results of NaF-TW, NaF-TW2, NaF-HW and NaF-HW2, respectively. The orange dashed lines, purple dashed lines and cyan solid lines in panel (k) denote the results of SH-1, SH-2 and NaF-TW, respectively. The black solid lines in panels (i)-(k) denote the numerically exact results produced by DVR2. data
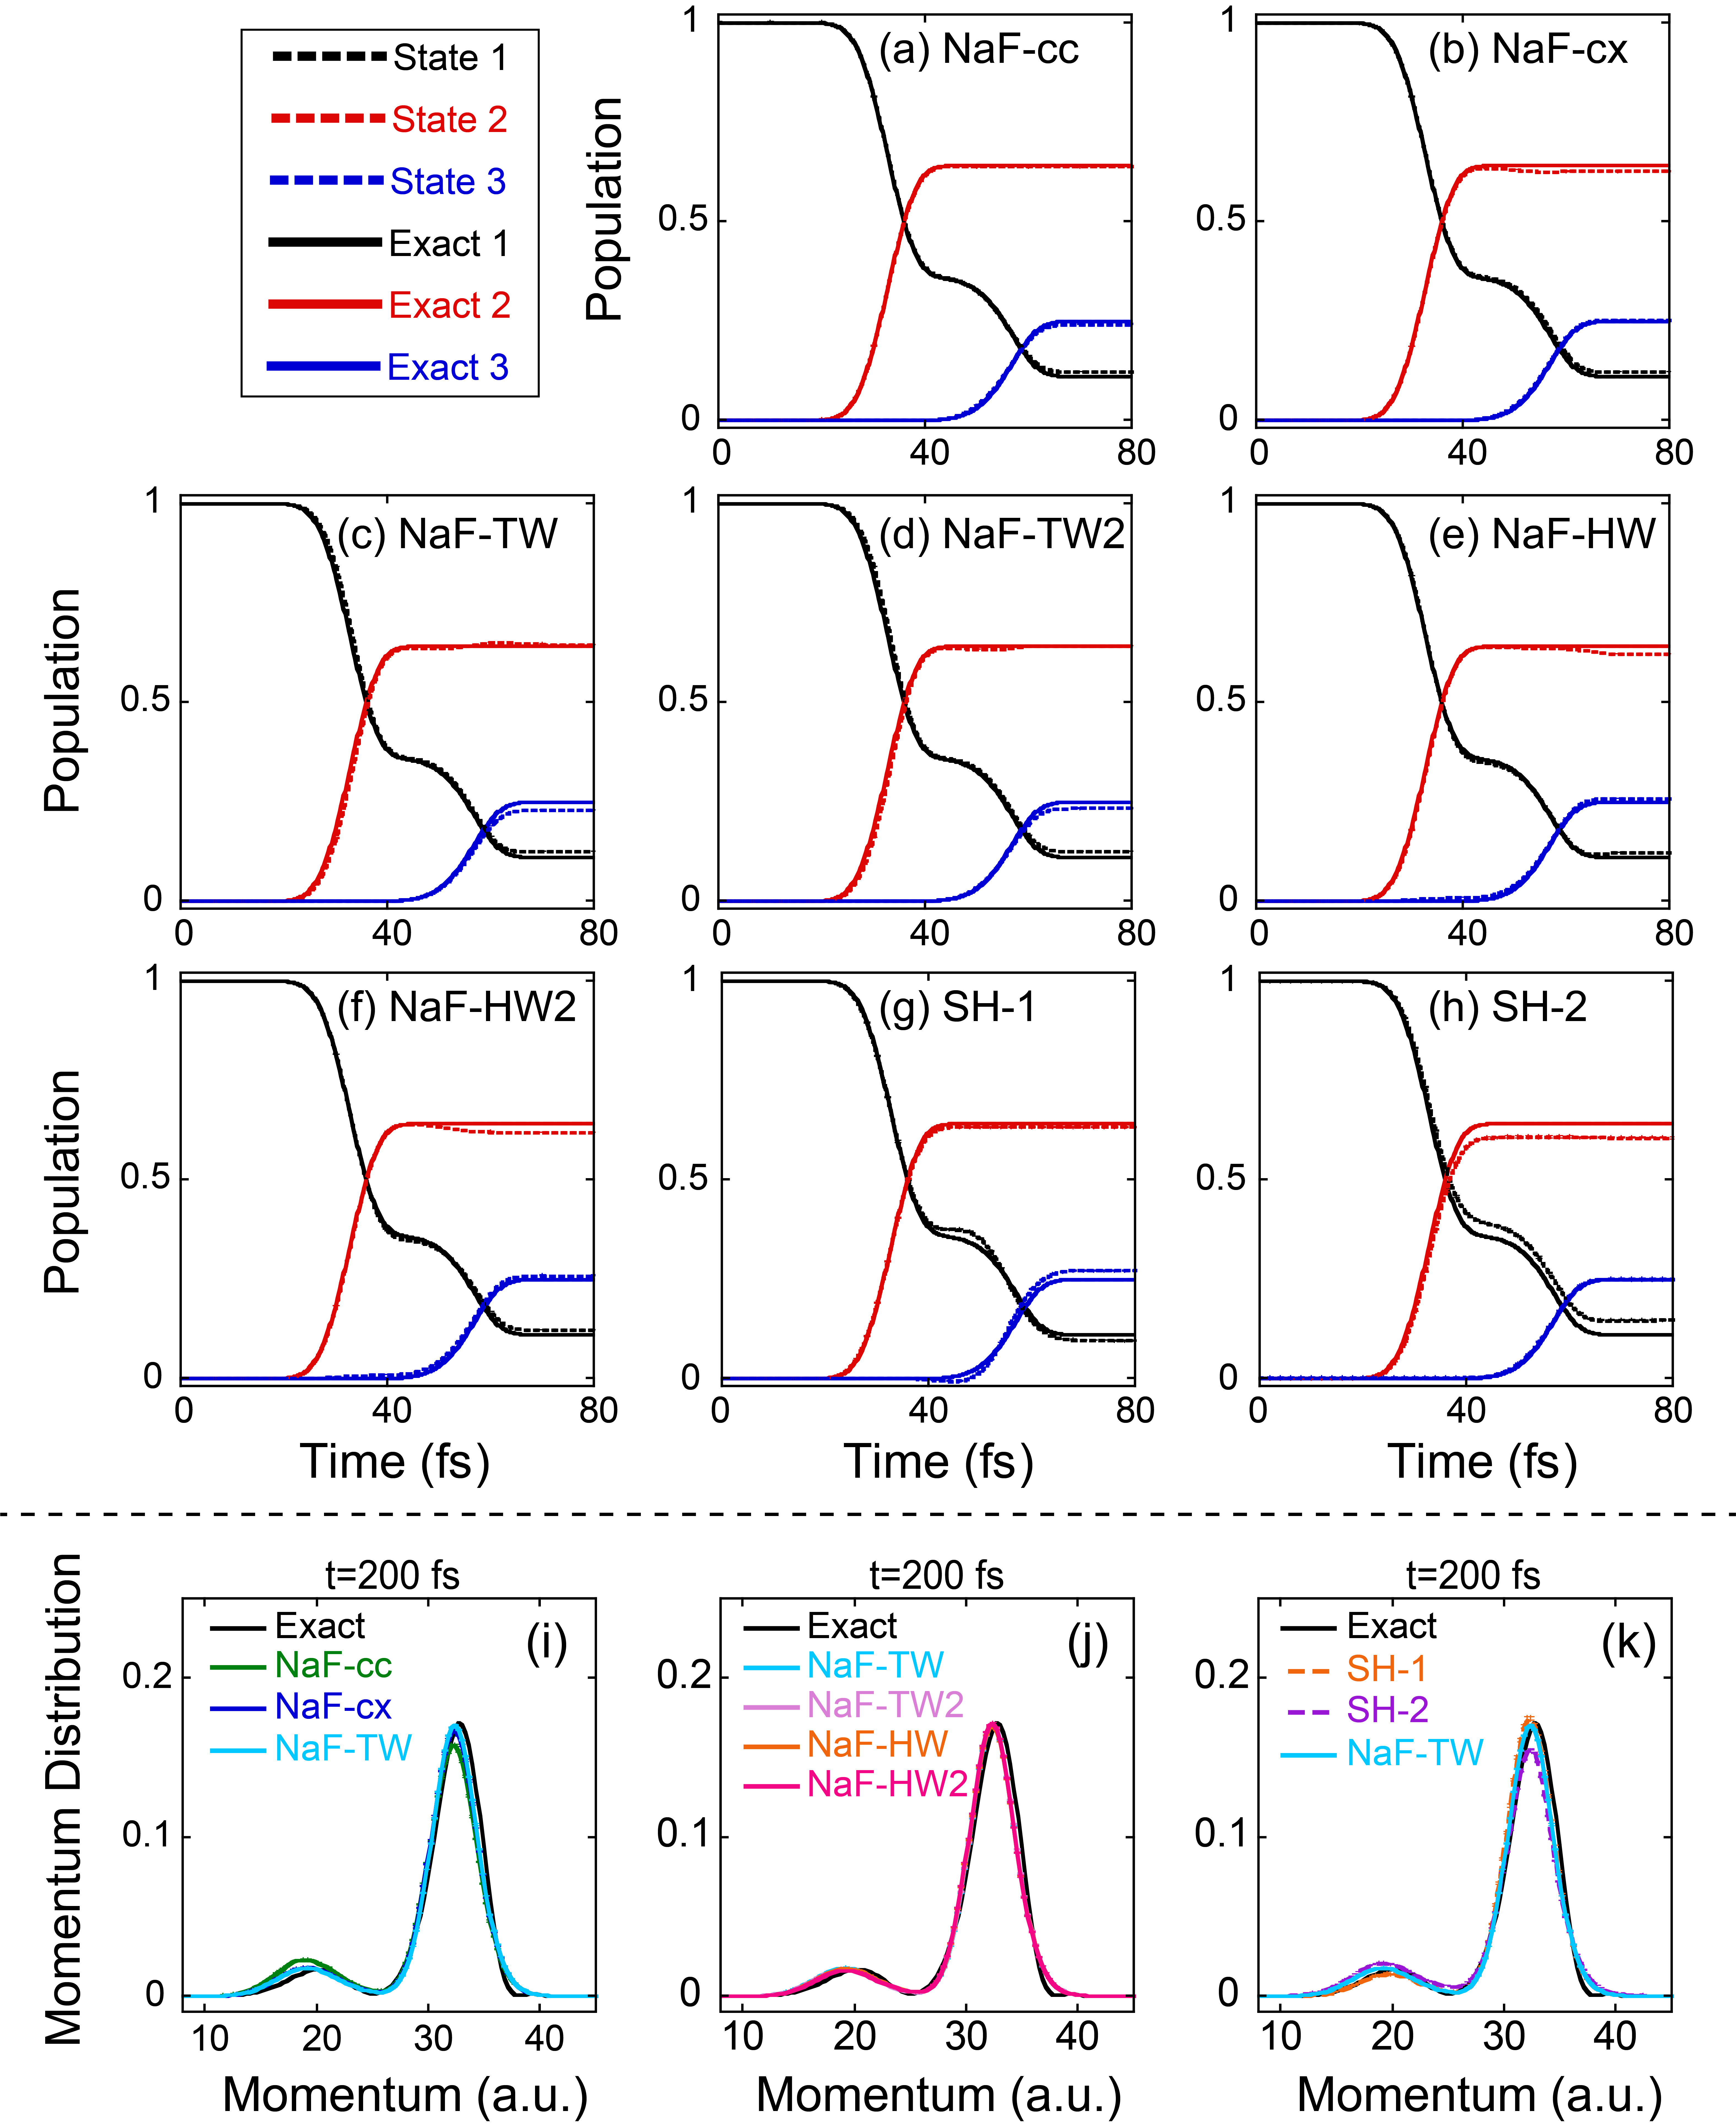
Figure S4. Results of Model 3 of the 3-state photodissociation models. In panels (a)-(h), the black, red and blue dashed lines represent population dynamics of states 1−3, respectively. Panel (a): NaF-cc. Panel (b): NaF-cx. Panel (c): NaF-TW. Panel (d): NaF-TW2. Panel (e): NaF-HW. Panel (f) NaF-HW2. Panel (g): SH-1. Panel (h): SH-2. Note that SH-3 is not applicable for this 3-state model. The numerically exact results produced by DVR2 are demonstrated by solid lines with corresponding colors in panels (a)-(h). Panels (i)-(k) illustrate the nuclear momentum distribution at 200 fs. The green, blue, and cyan solid lines in panel (i) represent the results of NaF-cc, NaF-cx and NaF-TW, respectively. The cyan, pink, orange and magenta solid lines in panel (j) denote the results of NaF-TW, NaF-TW2, NaF-HW and NaF-HW2, respectively. The orange dashed lines, purple dashed lines and cyan solid lines in panel (k) denote the results of SH-1, SH-2 and NaF-TW, respectively. The black solid lines in panels (i)-(k) denote the numerically exact results produced by DVR2. data